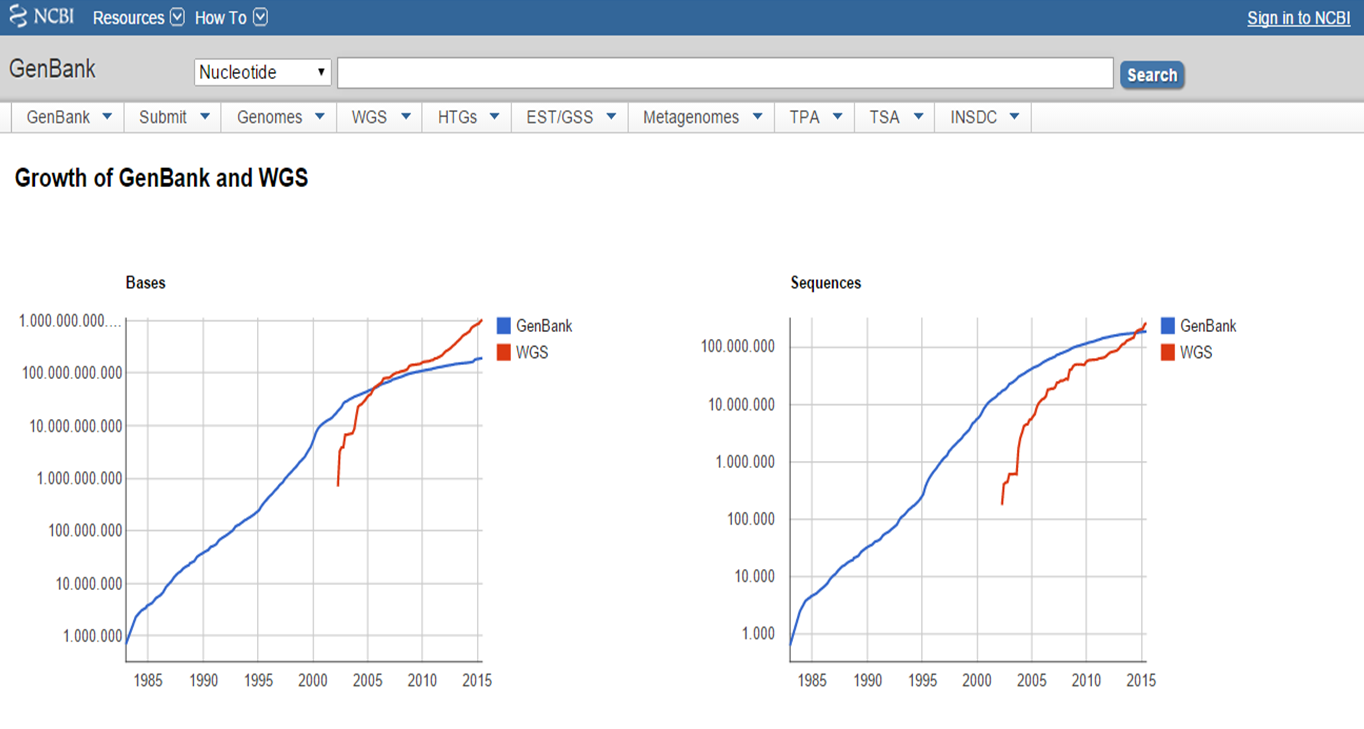
The growth of the GenBank database with the advent of WGS
With expanding our knowledge in life sciences comes the increasing amount of information from published literature, scientific experiments, experiments with high-throughput sequencing technology and computational analysis (e.g. the growth of the sequence database GenBank with the advent of whole-genome sequencing (http://www.ncbi.nlm.nih.gov/genbank/statistics/)).
The growth of the GenBank database with the advent of WGS
Such information is stored in biological databases. Many different databases can be found depending on domain of interest, data and species type.
To divide biological databases the type of data can be used: published literature, DNA and RNA sequences, protein sequences or structures, probes, SNPs, pathway information, genes, gene expression and gene ontology, and gene/phenotype interactions.
Depending on this data type many different biological databases are available. Besides individual database structures certain providers of databases can be identified, such as NCBI and Ensembl. Individual databases may be incorporated into a collaborative project and synchronize their data with eachother.
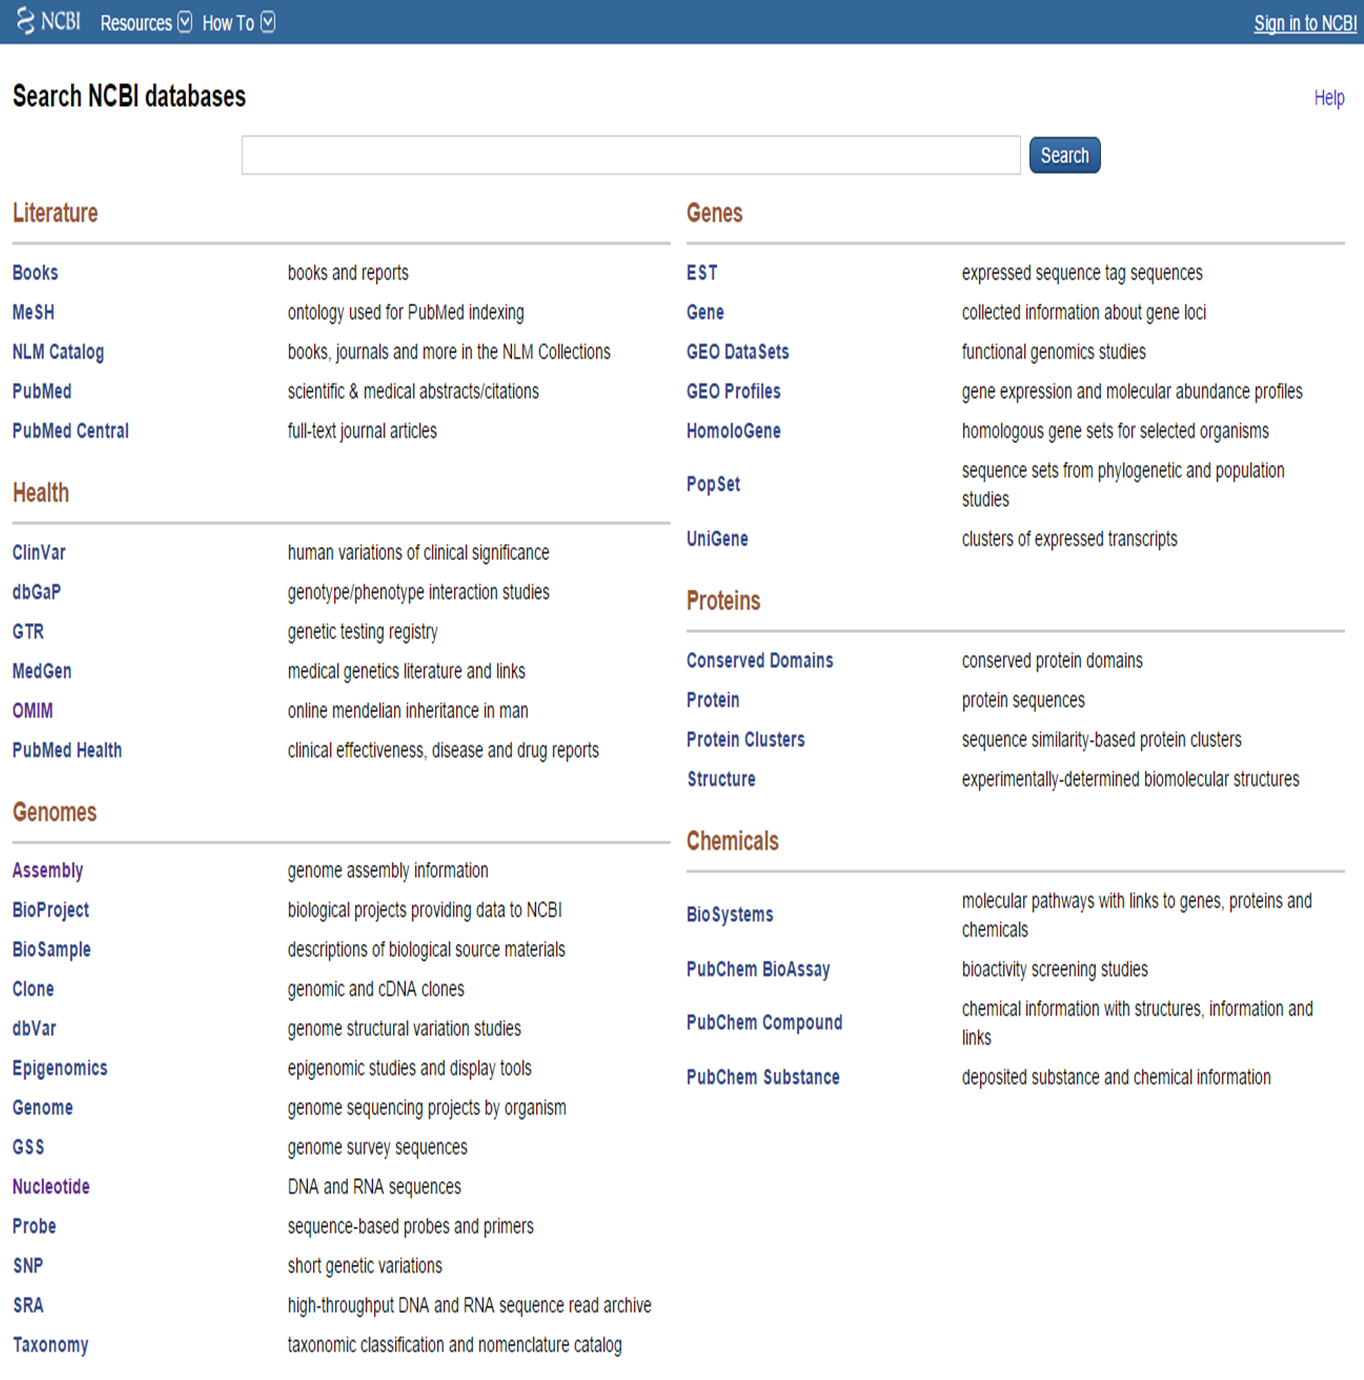
Here, an overview of available biological databases is provided for different data types either in one large framework of multiple databases or in individual databases.
The National Center for Biotechnology Information (NCBI) was established in 1988 at the National Institutes of Health (NIH) to develop computerized methods for storing and analyzing data from different biomedical research fields.
NCBI harbors multiple biological databases with data ranging from literature (PubMed), genomes (Nucleotide, Gene), gene/phenotype interactions (OMIM) to proteins (Protein, Structure).
GQuery: Global Cross-database NCBI makes it possible to search across all databases harbored by NCBI.
GQuery at NCBI
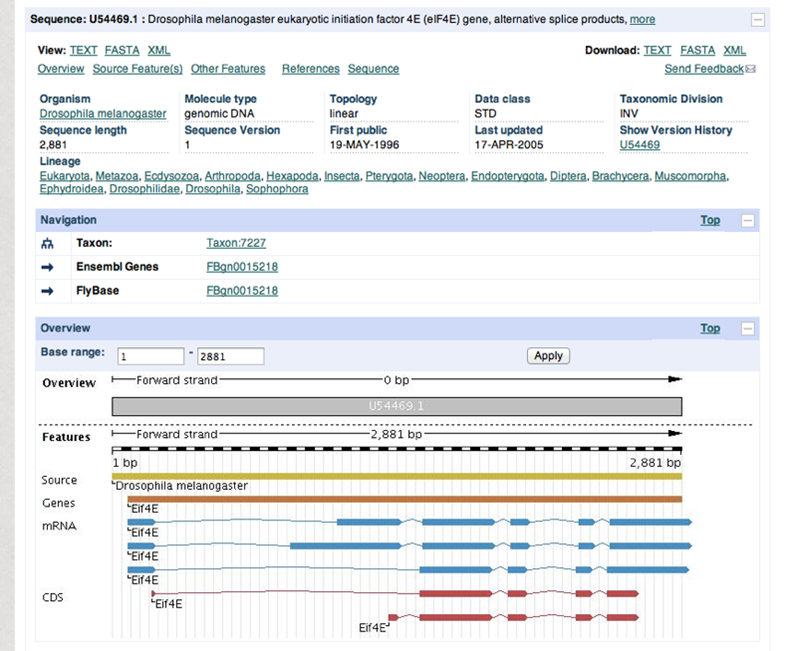
The Nucleotide database (http://ncbi.nlm.nih.gov/nucleotide) is a collection of all publicly available nucleotide sequences and its translation sequences from several sources, such as GenBank and RefSeq databases.
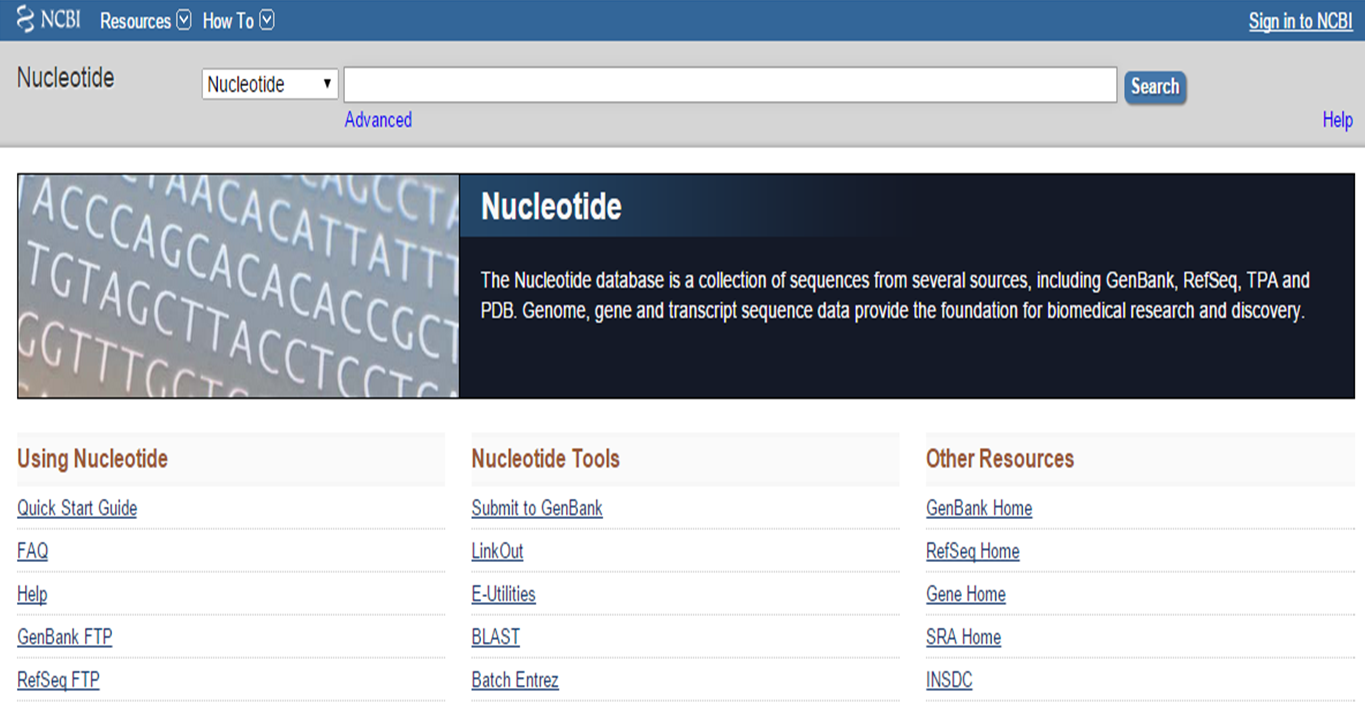
Nucleotide database homepage at NCBI
Searching the Nucleotide database can be done by using a gene name, gene symbol or protein name. Database specific identifiers for sequences, accession numbers, will provide the sequence record of choice. Author names should be searched for with last name and initials (e.g. Kent TM).
Search records are shown in GenBank format on the NCBI website. Information can be downloaded in a flatfile with GenBank format (.gb). This format includes three main sections: header, features and sequence (Figure 2). The header contains information such as the organism, authors, journal and PubMed identifier. Features contain gene name, mRNA and CDS (coding sequence) transcripts. Figure 3 and 4 show a detailed view of the header and features section.
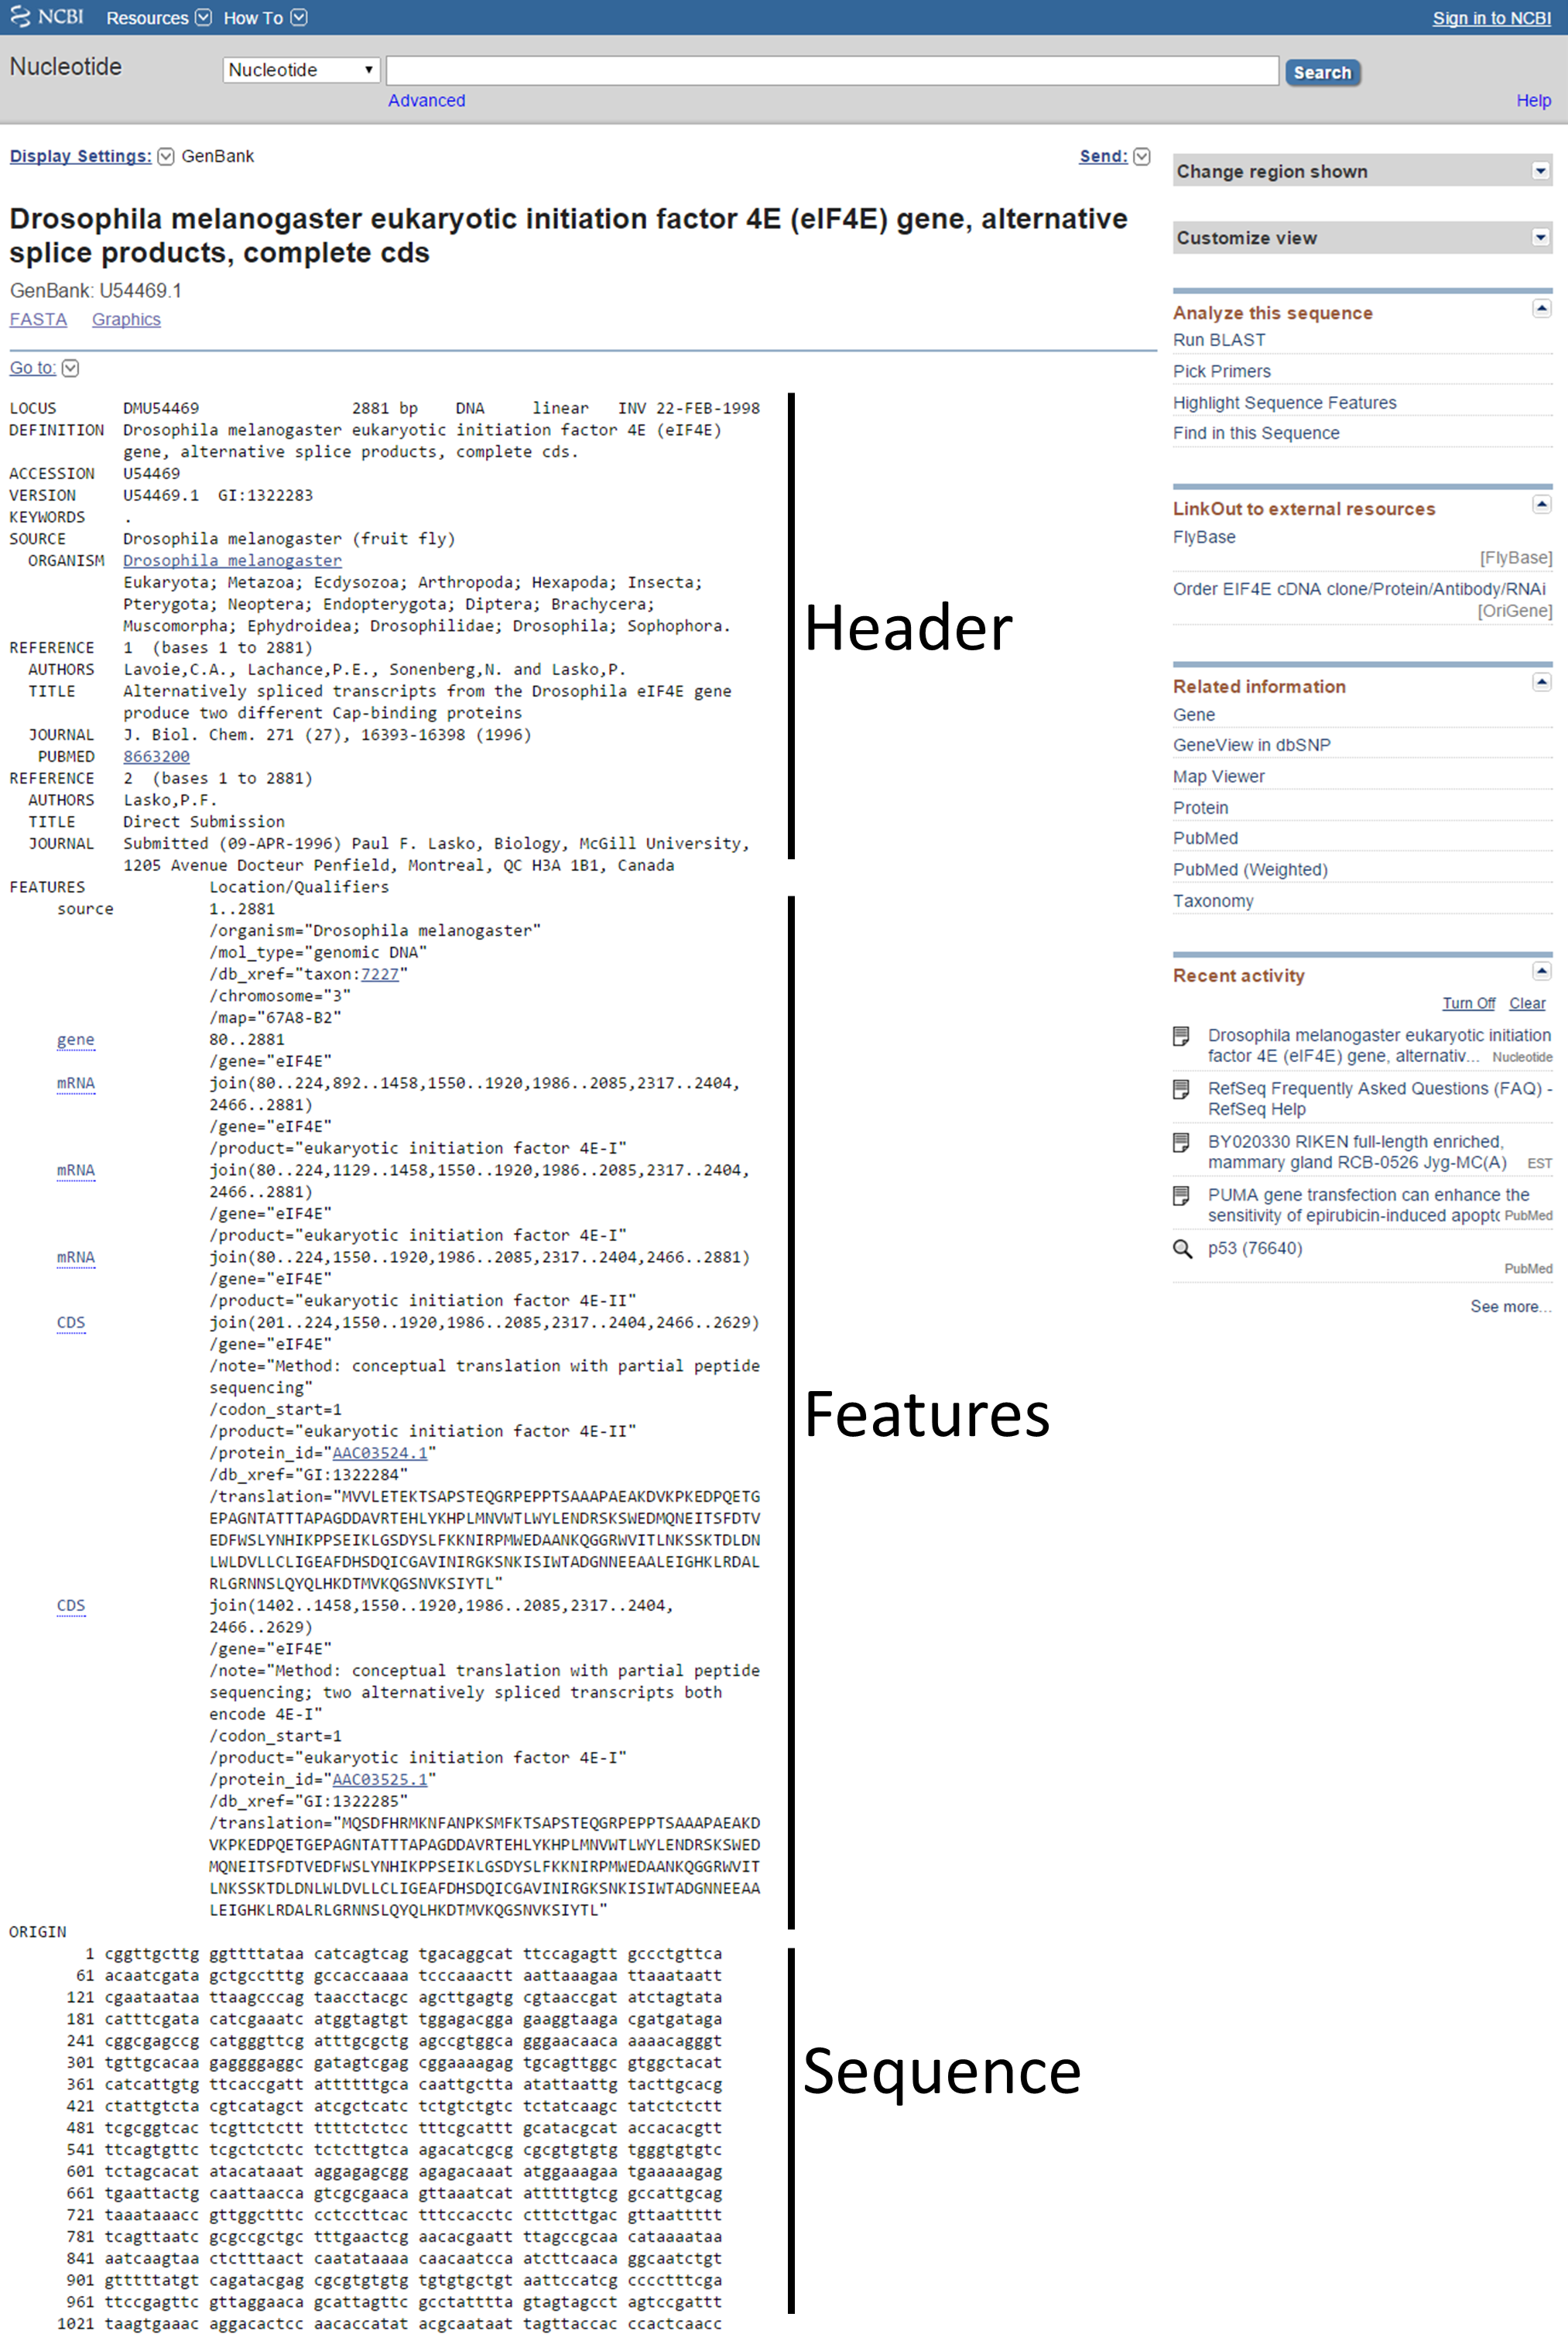
Overview of search record in the Nucleotide database with three sections from GenBank format

Header section in GenBank format file
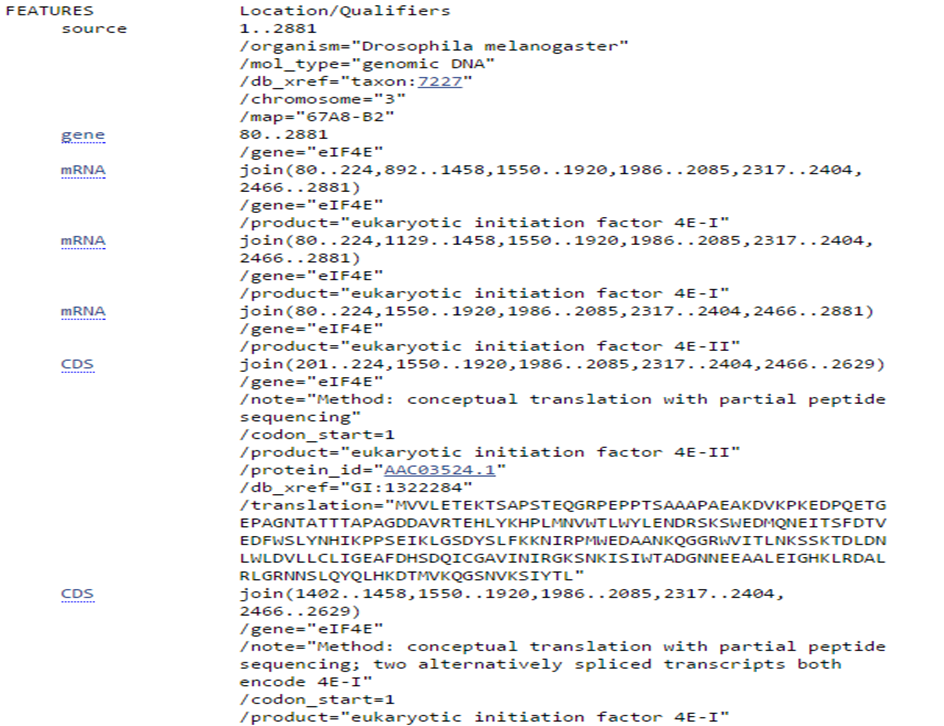
Features section in GenBank format file
Coding sequence (CDS) consists of multiple exons. Exons are defined by a start and stop position (e.g. 201..224) and seperated by a comma, which represents a splicing event (e.g. 201..224,1550..1920).
The features can also be shown in graphic format to show the different mRNA and CDS products by selecting 'Graphics'.
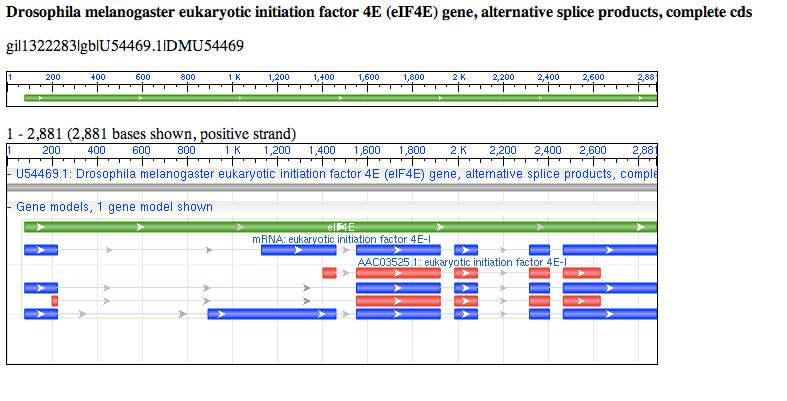
Graphic representation of the features in GenBank format
Sequence can be viewed in the flatfile FASTA format by selecting FASTA. FASTA format is characterized by a first line with an > followed by a sequence identifier and on a new line the nucleotide or peptide sequence.
FASTA format of nucleotide and peptide sequence
Use the Quick Start Guide on the Nucleotide database homepage for additional information.
The GenBank database, hosted by NCBI, provides a annotated collection of publicly available DNA and cDNA sequences (http://ncbi.nlm.nih.gov/genbank). GenBank data is synchronized every day with data from the DNA Databank of Japan (DDBJ) and the European Molecular Biology Laboratory (EMBL).
The European Nucleotide Archive (ENA), hosted by European Molecular Biology Laboratory - the European Bioinformatics Institute (EMBL-EBI) contains annotated DNA and RNA sequences http://http://www.ebi.ac.uk/ena.
Search records have a more graphical representation, but can also be viewed and downloaded in TEXT style format from EMBL. TEXT/EMBL format shows similarities with the GenBank format. Each line contains a data characteristic preceded by a code representing the type of information. A detailed description of the codes used in the EMBL format can be found on the following link: ftp://ftp.ebi.ac.uk/pub/databases/embl/doc/usrman.txt.

TEXT format of ENA (EMBL-EBI) search record
ENA (EMBL-EBI) search record
The RefSeq (NCBI Reference Sequence) database aims to provide a set of reference sequences for genomic, transcript and protein sequences, which are annotated and non-redundant. The goal is to provide a reference sequence for each molecule (DNA, mRNA and protein), whereby one RefSeq record represents a single, naturally occuring molecule from one organism. In contrast with GenBank each reference sequence is only represented once in the RefSeq database, making it non-redundant. Nucleotide and protein sequences are linked to eachother in this database and all RefSeq entries undergo ongoing curation to assure the most up-to-date state of each DNA, mRNA or protein sequence.
The RefSeq database uses accession numbers in the following format: 2 letters, followed by an underscore, followed by a six-digit number.
e.g. NT_123456 (Genomic contigs), NM_123456 (mRNAs), NP_123456 (Proteins), XM_123456 (Model mRNAs) and XP_123456 (Model proteins).
RefSeq accession numbers for models represent computational predictions of sequences.
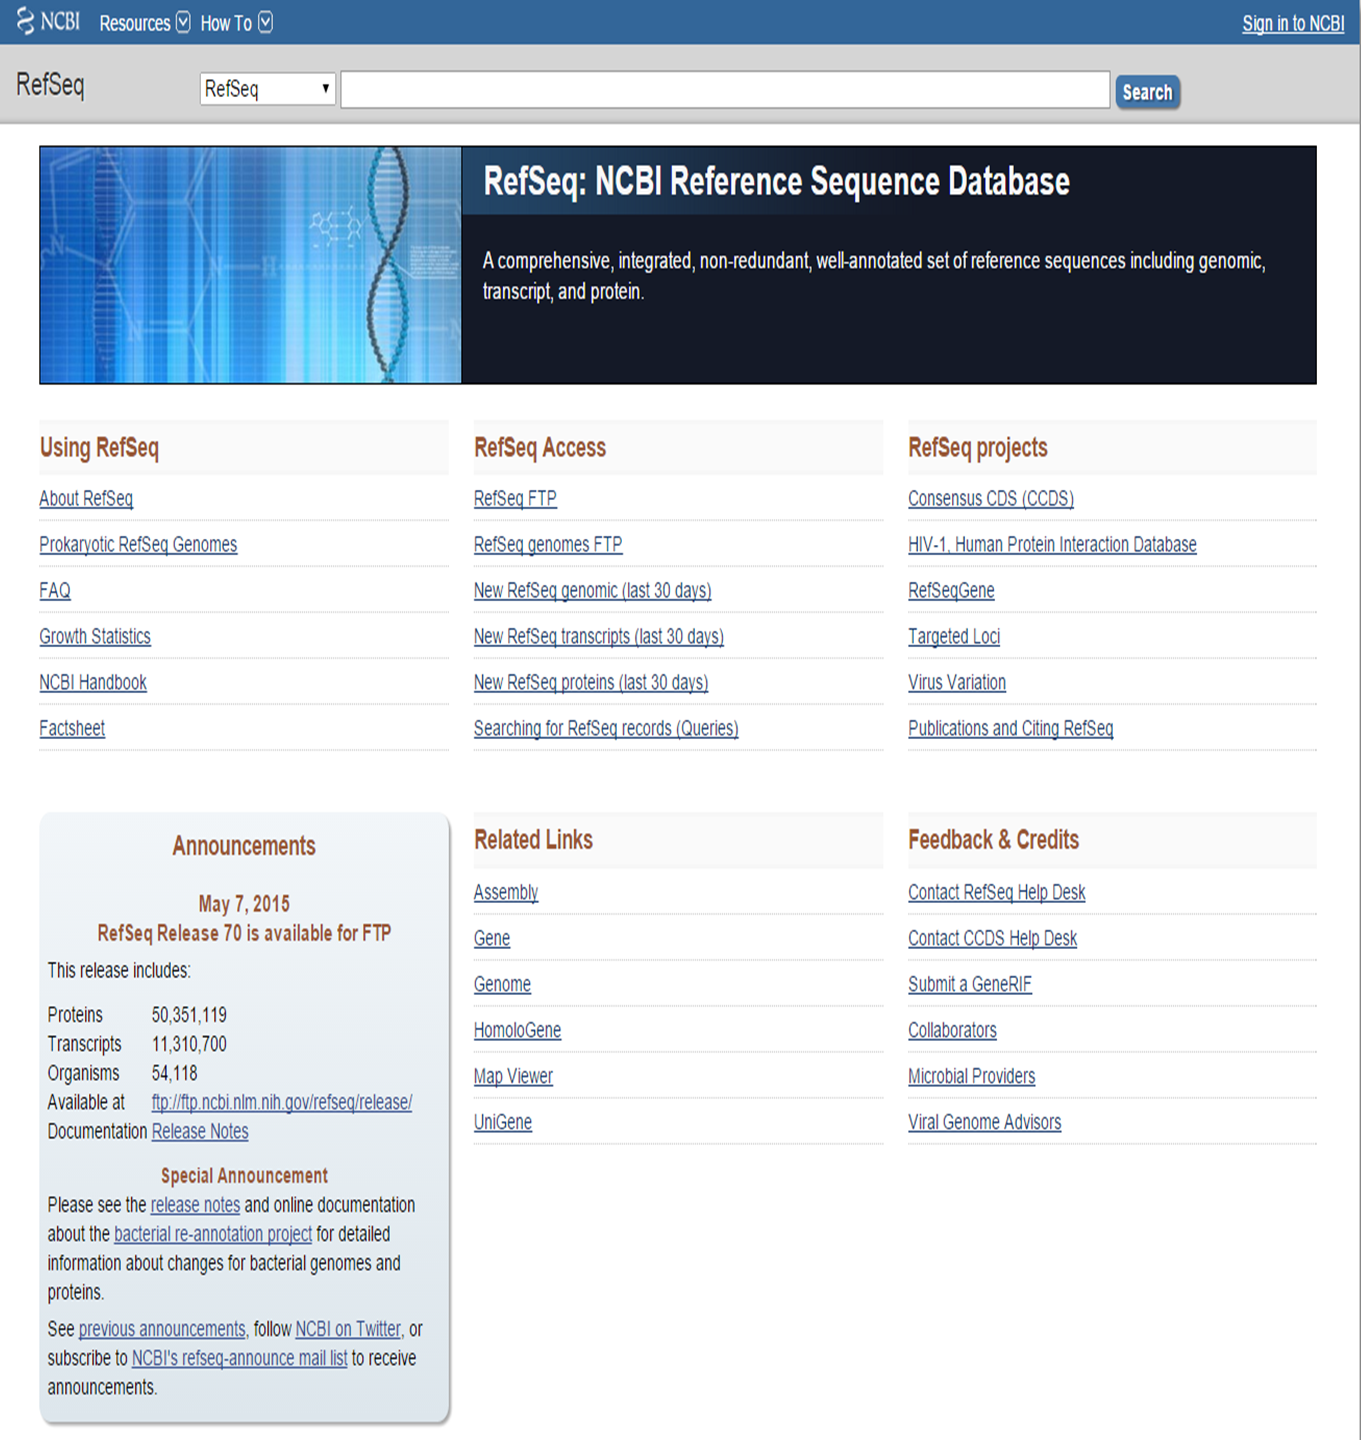
RefSeq database homepage at NCBI
Exercise 1.3. Nucleotide database (RefSeq) search: filtering records
Since 'next-generation' sequencing technologies have gained popularity, more and more data becomes available for analysis. Through this one can access many datasets from sequencing experiments.
The Sequence Read Archive (SRA), hosted by NCBI, allows data submission from high-throughput sequencing platforms such as Roche 454 GS System, Illumina Genome Analyzer and Pacific Biosciences SMRT(http://www.ncbi.nlm.nih.gov/sra/). Hereby, sequencing datasets become available for replicated analysis or the ability to compare datasets in an experimental setup. The SRA is part of The International Nucleotide Sequence Database Collaboration (INSDC), which contains a collaboration between DDBJ, EMBL-EBI and NCBI. SRA contains raw data and the most preferrable format is BAM. BAM is the binary format of the human-readable SAM format, in which raw read data and alignment information is stored. For an entry in the SRA database experimental metadata is also available.
The European Genome-phenome Archive (EGA), hosted by EMBL-EBI, contains different types of sequencing and genotype data from array and sequencing methods (https://www.ebi.ac.uk/ega/home). This database can count as the European counterpart of the SRA. Many different data formats are accepted, such as raw unaligned or aligned files for sequencing, raw and intensity files for array and phenotype data. Data in EGA is not publicly available. The archive itself can be browsed through open access, however data access is controlled.
Two main types of acquiring protein sequences for databases exist:
protein sequences can be derived from translation of nucleotide sequences, which we call secondary databases;
e.g. nucleotide sequence from RefSeq entry can be translated into protein sequence (RefSeq NM_ to RefSeq NP_)
Two databases that base their protein sequences on the translation of nucleotide sequences are: the NCBI Protein database (http://www.ncbi.nlm.nih.gov/protein/) and trEMBL (translated EMBL Nucleotide Sequence Data Library), which is part of the Uniprot Knowledgebase database http://www.uniprot.org/.
protein sequences can be curated through computational analysis and then undergo manual review and annotation
SwissProt, which is part of the Uniprot Knowledgebase database, represents this type of data acquirement for generating protein sequences (http://www.uniprot.org/).
Exercise 1.5. Protein sequence databases: integration of literature search
The GFF (General Feature Format) format is another important format type which represents the features of a particular gene, DNA and protein sequence. Features represent groups of amino acids which generate certain characteristics for the protein or which are important for a certain function. This is similar to the features section in the GenBank format with nucleotide sequences, which displayed the different mRNAs or coding sequences. The GFF format is a tab-delimited file and consists of one line per feature and each with 9 columns of data and can be opened with a text editor (http://www.ensembl.org/info/website/upload/gff.html).
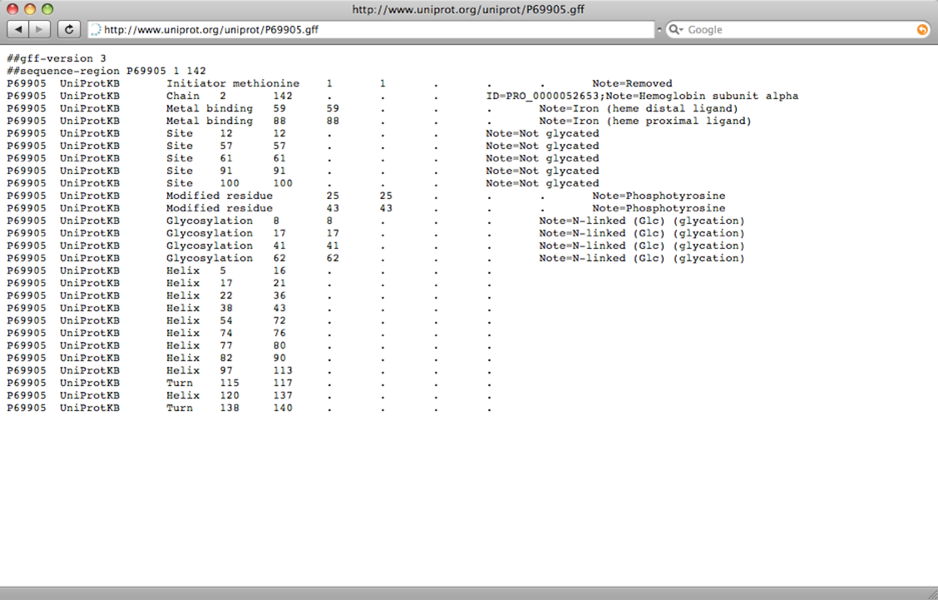
GFF format file
Additional to the sequence is the protein structure. Most protein structures have been determined through the use of X-ray crystallography. However, protein structures can also be modeled through computational predictions of the structure based on the protein sequence.
Protein structures can be found in the Protein Data Bank (RCSB PDB, http://www.rcsb.org/pdb/home/home.do) or in the NCBI Protein database (http://www.ncbi.nlm.nih.gov/structure/).
The Gene database, hosted by NCBI, allows gene-centric information retrievel from species such as human, mouse, rat, zebrafish, etc. Each search record provides information such as a summary, genomic context, bibliography, phenotype, sequence(s), RefSeq data, GeneRIF (Gene References into Function), interactions, homology, Gene Ontology, etc.
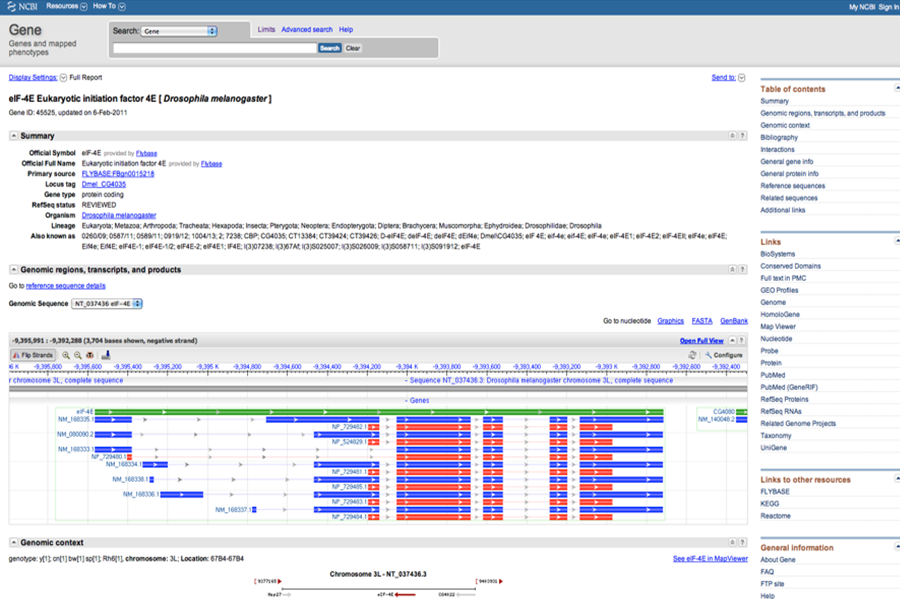
Gene database at NCBI search record
In order for a gene to become a functional gene product, the gene has to be expressed. This gene expression data can be curated from literature describing immunohistochemistry or in situ hybridization experiments from animal tissues such as the mouse brain or fly embryos. Gene expression can also be measures through microarrays.
With the Gene Expression Omnibus (GEO) (http://www.ncbi.nlm.nih.gov/geo/) it is possible to search for gene expression datasets with GEO DataSets and for a specific gene expression profile with GEO Profiles.

Gene Expression Omnibus homepage at NCBI
The Expression Atlas, hosted by EMBL-EBI, provides gene expression data from different experiments (https://www.ebi.ac.uk/gxa/home).
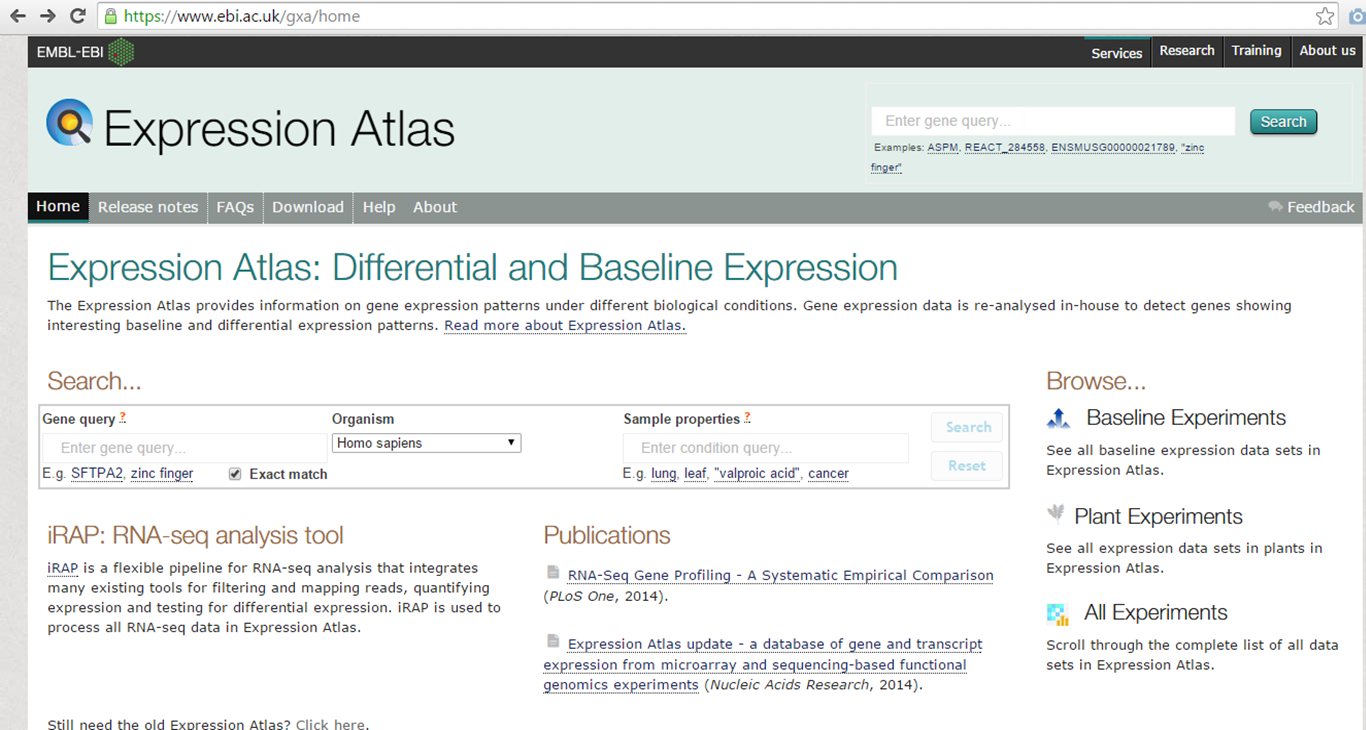
Expression atlas homepage
In the Expression Atlas it is possible to search for genes but also for sample properties, such as certain tissues. Searching for 'muscle cell', gives us a list of differentially expressed genes in certain expression datasets. Blue indiciates the gene is downregulated, red means upregulated.

Expression atlas homepage
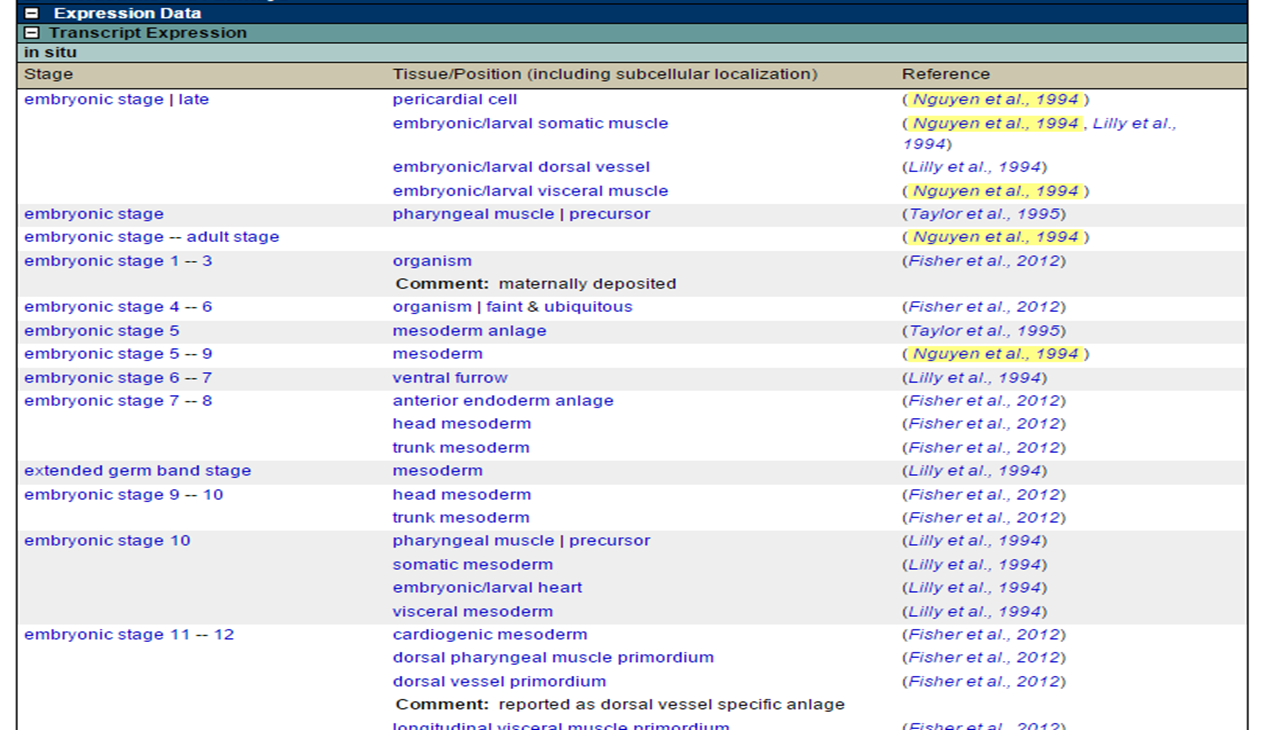
For certain species, such as Drosophila Melanogaster, expression data is also available.
For example, in the search record for the gene Mef2, you can find the reported transcript expressions with the corresponding tissue and stage:
Expression atlas homepage
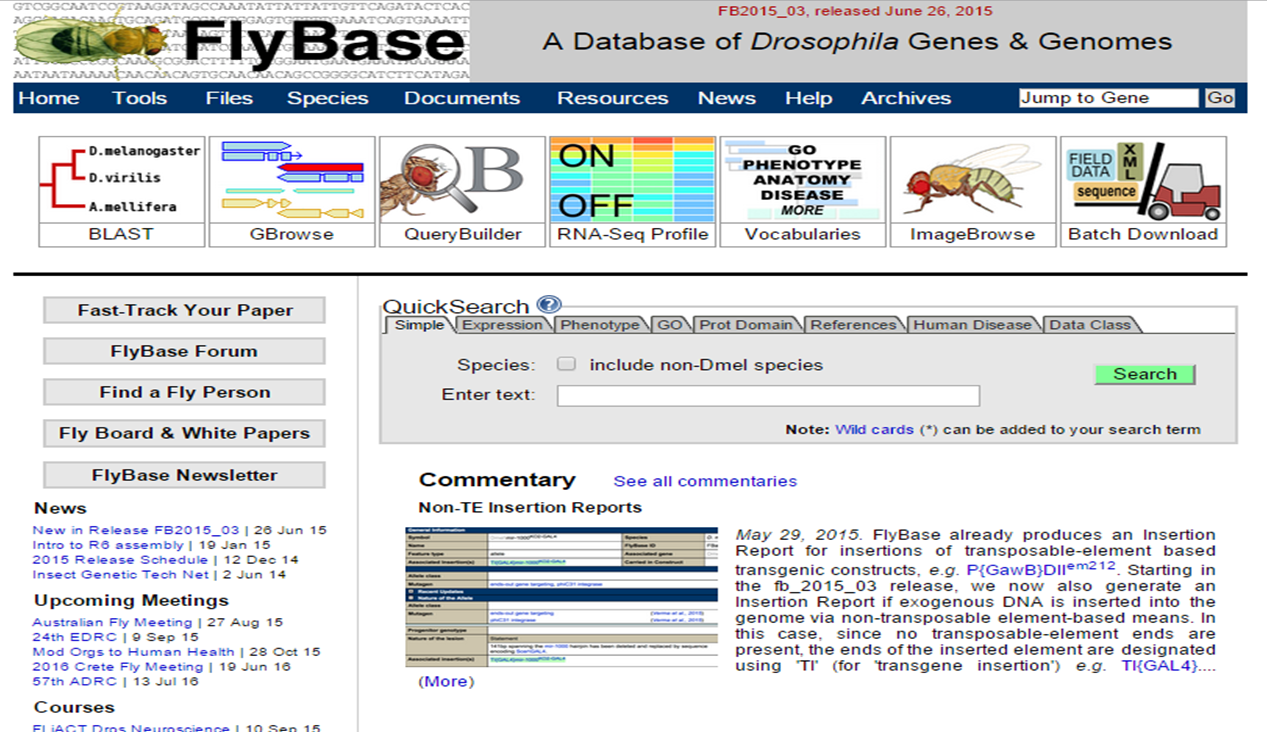
One can also find genes known to be expressed in a certain tissue, which we call curated, via the Vocabularies tab on the homepage of FlyBase :
Expression atlas homepage
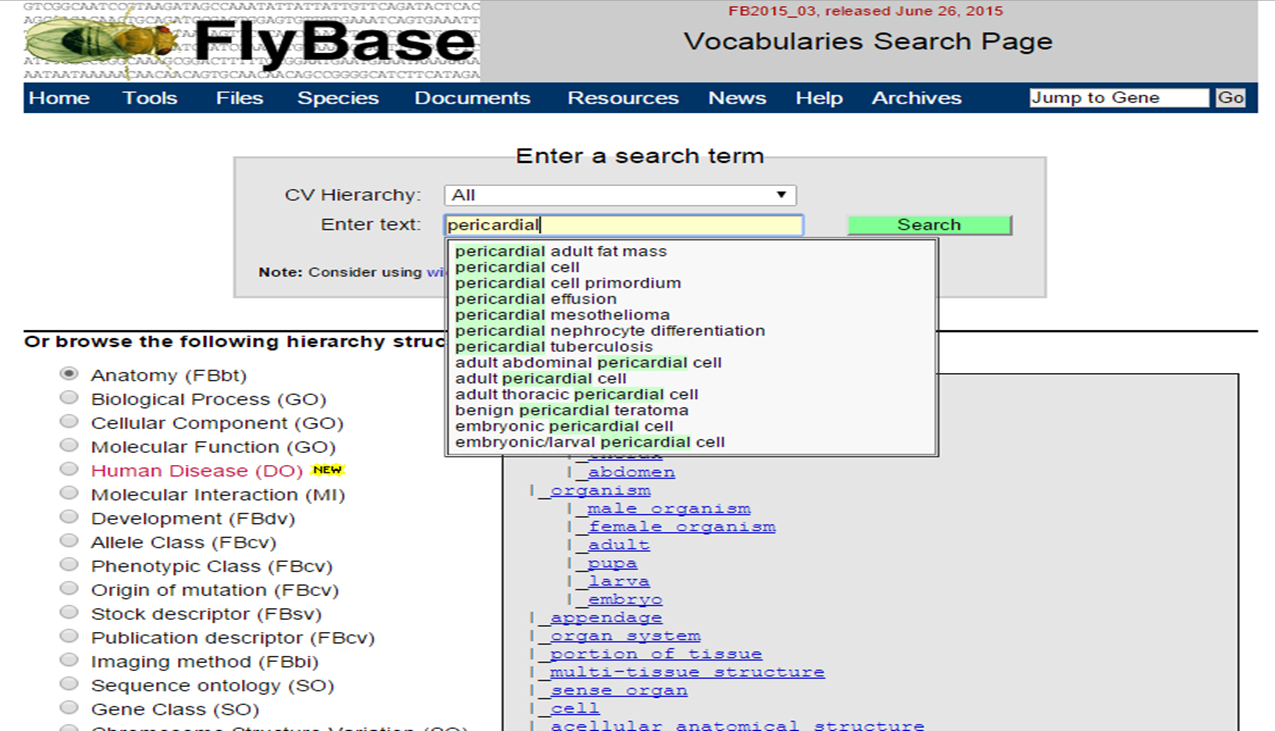
In the Vocabularies, search for 'pericardial cell' :
Expression atlas homepage
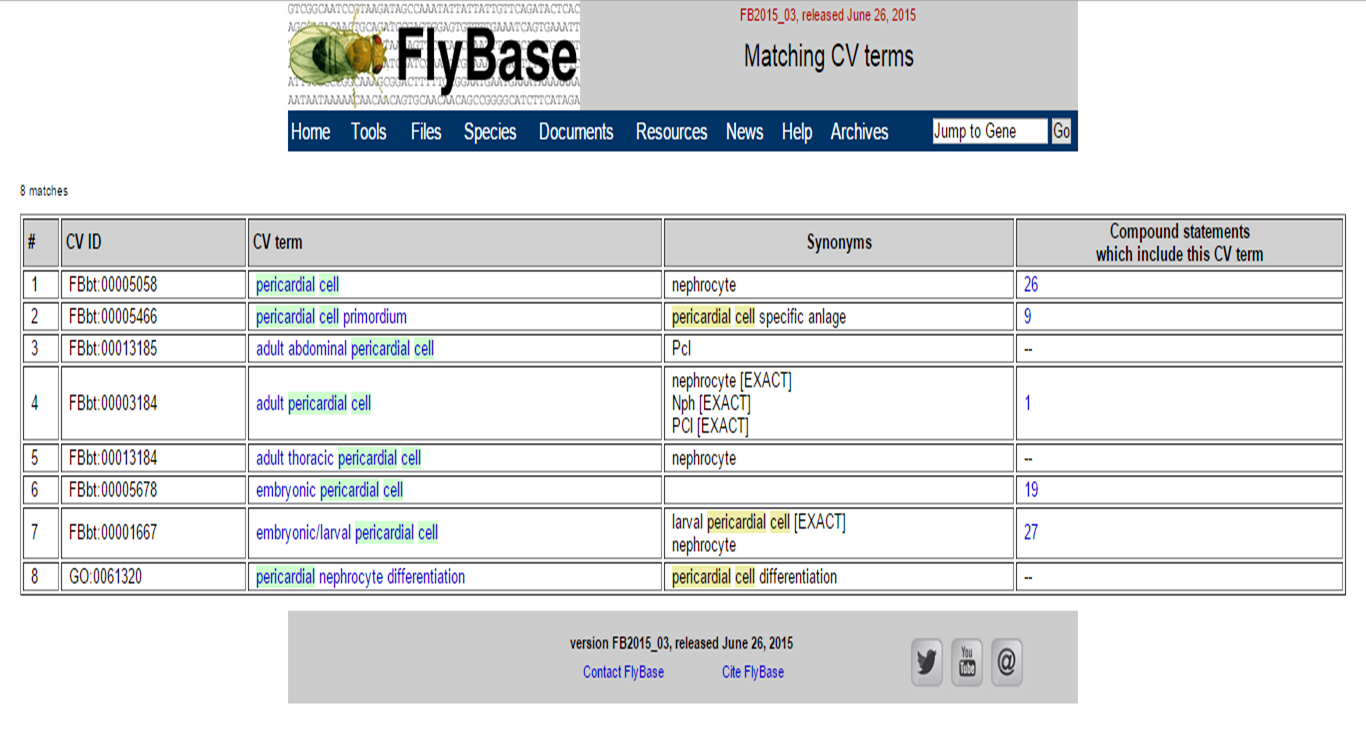
You will get an overview of terms, which include 'pericardial cell'.
Expression atlas homepage
Clicking on a term will lead you to see the annotations page of this term.
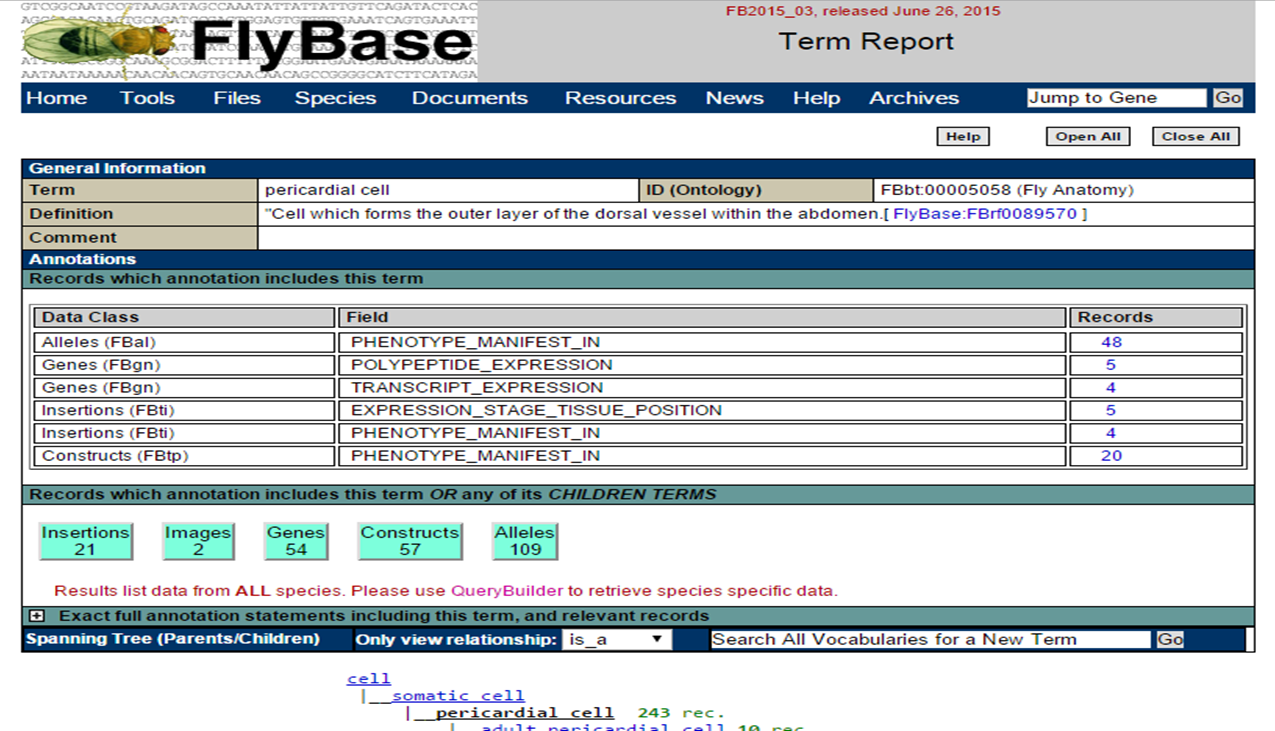
Expression atlas homepage
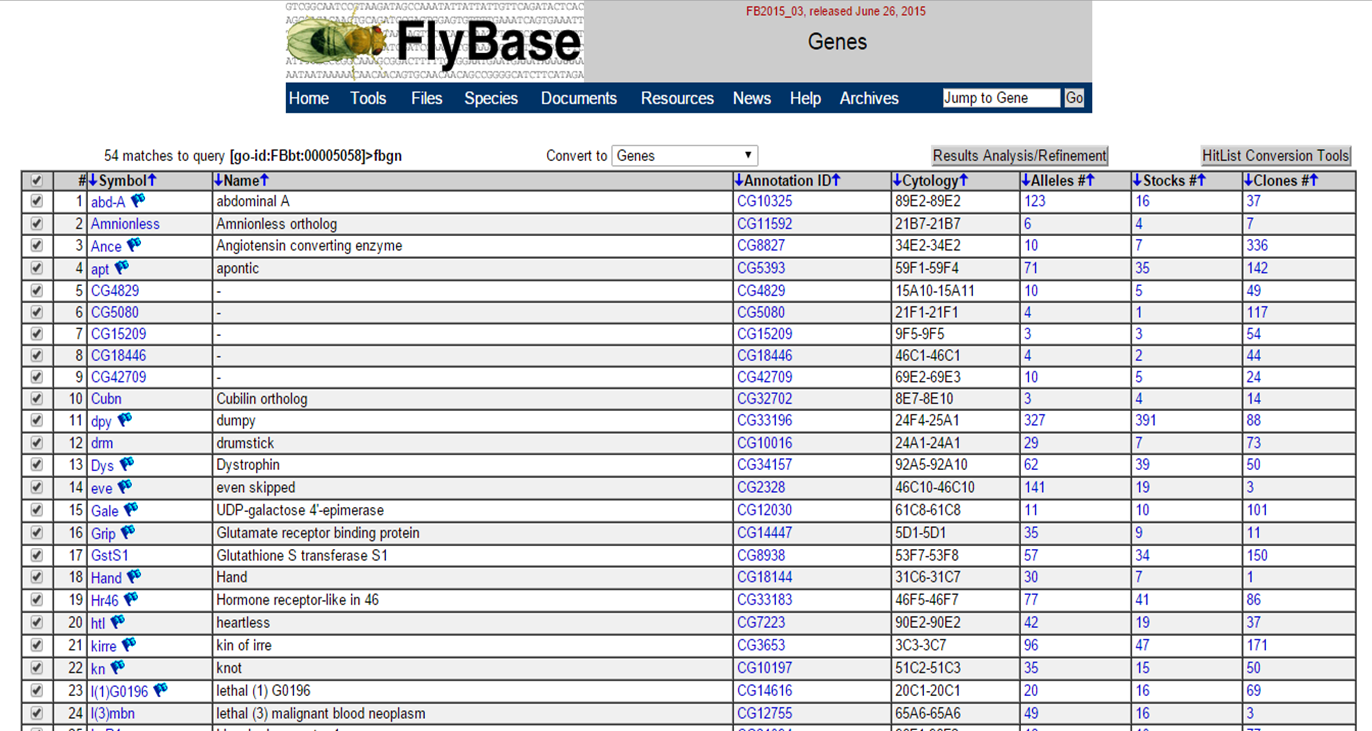
Clicking 'Genes' allows you to see all genes associated with this term:
Expression atlas homepage
Gene ontology is derived from the concept of ontology in computer science and information science, which aims to provide a formal representation of a set of concepts within a domain and the relationships between those concepts.
The Gene Ontology project is a collaboration in order to generate consistent descriptions of gene names across databases. GO has generated three structured and controlled vocabularies that describe gene products in terms of their associated biological processes, cellular components and molecular functions in a species-independent manner (e.g. cell cyle, nucleus and ATP binding, respectively). By means of these terms, one can identify what a gene does, where it functions and in which processes.
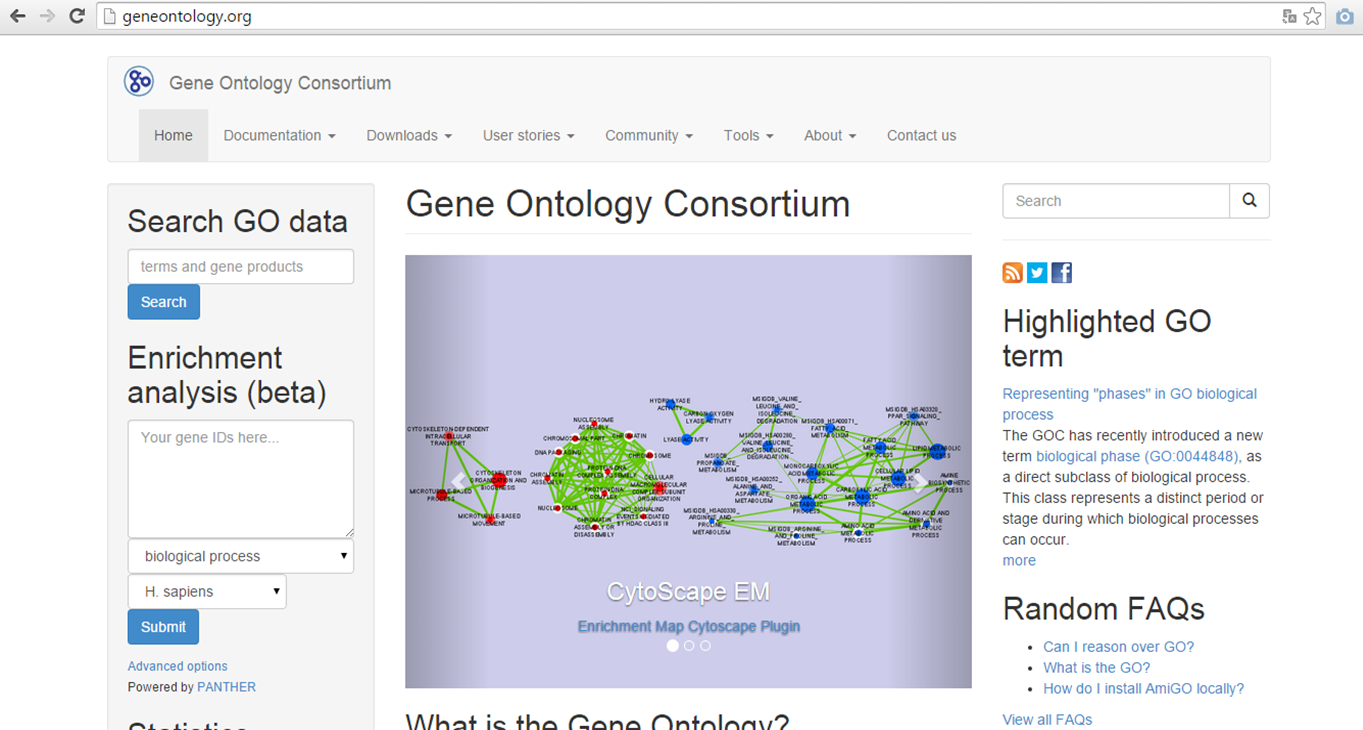
Gene Ontology homepage
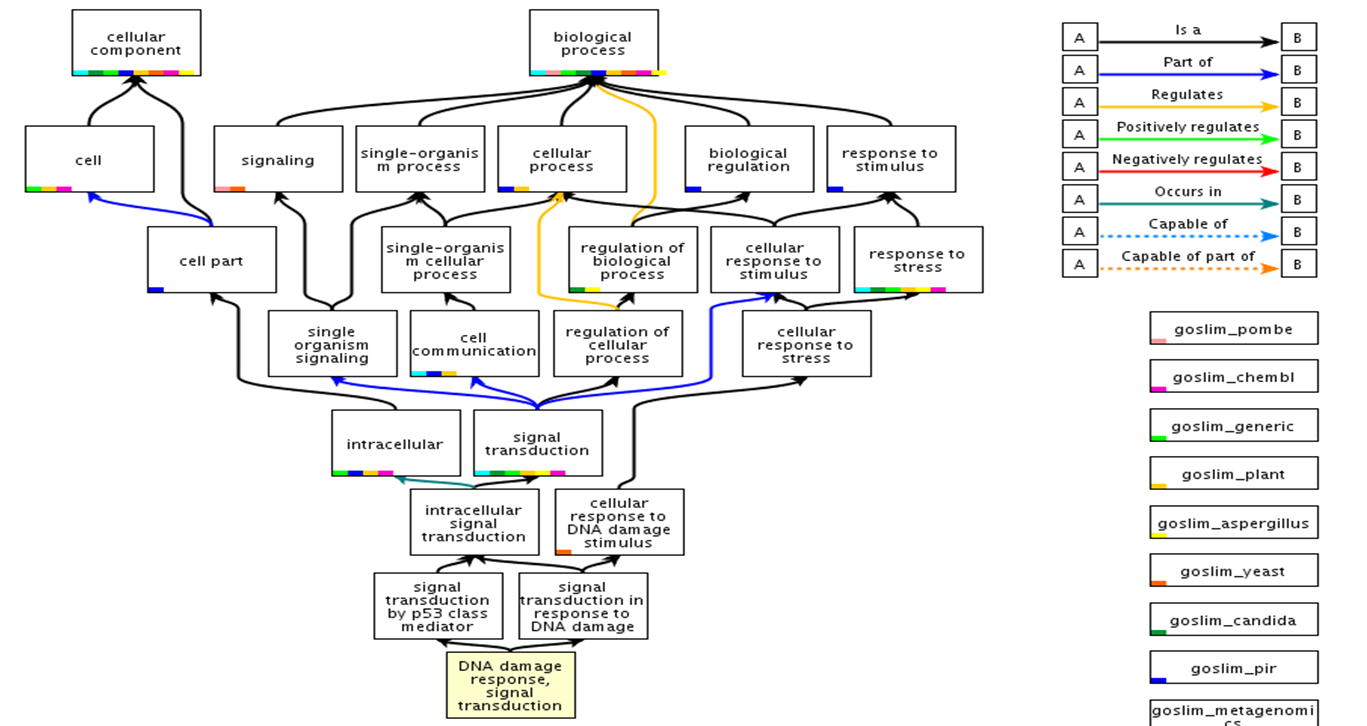
To organize the ontology terms, they are linked by two main relationships:
is-a: e.g. cytoplasmic membrane is-a membrane
part-of: e.g. nucleus part-of cell
To find more information about relationships in Gene Ontology between terms, check out: http://geneontology.org/page/ontology-relations.
Ontologies for biological processes, cellular components and molecular functions can be hierarchically structured. Hereby, parent and child terms are defined. A parent represents a broader term, while a child represents a more specific term (e.g. parent: cell, child: nucleus). Terms can have more than one parent and none to multiple children. Here, http://geneontology.org/page/ontology-structure, you can find more information about the structure of Gene ontology terms.
p53 Gene Ontology structure
For a general overview of Gene Ontology: http://www.geneontology.org/teaching_resources/presentations/2007-05_GO-OBO-intro_JL.ppt.
The Online Mendelian Inheritance in Man database represents a catalog of human genes, genetic disorders and phenotypes (http://www.omim.org, http://www.ncbi.nlm.nih.gov/omim). Links are provided between genetic variations and phenotypic expressions.
OMIM entries are characterized by an unique six-number digit:
1----- and 2----- for autosomal loci or phenotypes (entries created before May 15, 1994)
3----- for X-linked loci or phenotypes
4----- for Y-linked loci or phenotypes
5----- for mitochondrial loci or phenotypes
6----- for autosomal loci or phenotypes (entries created after May 15, 1994)
Allelic variants of a certain gene are characterized by the six-number digit of the OMIM entry, followed by a point and a four-number digit variant number: e.g. 607108.0001
OMIM entries marked with:
an asterisk (*) indicates a gene
a number symbol (#) indicates a descriptive entry of a phenotype
For more information on OMIM database: http://www.omim.org/help/faq
Querying a certain gene or protein in databases will provide you information about the gene/phenotype interaction. Often the corresponding OMIM link is also provided. For example, searching the NCBI Gene database for the human PAX6 gene, gives us information about phenotypes associated with this gene:
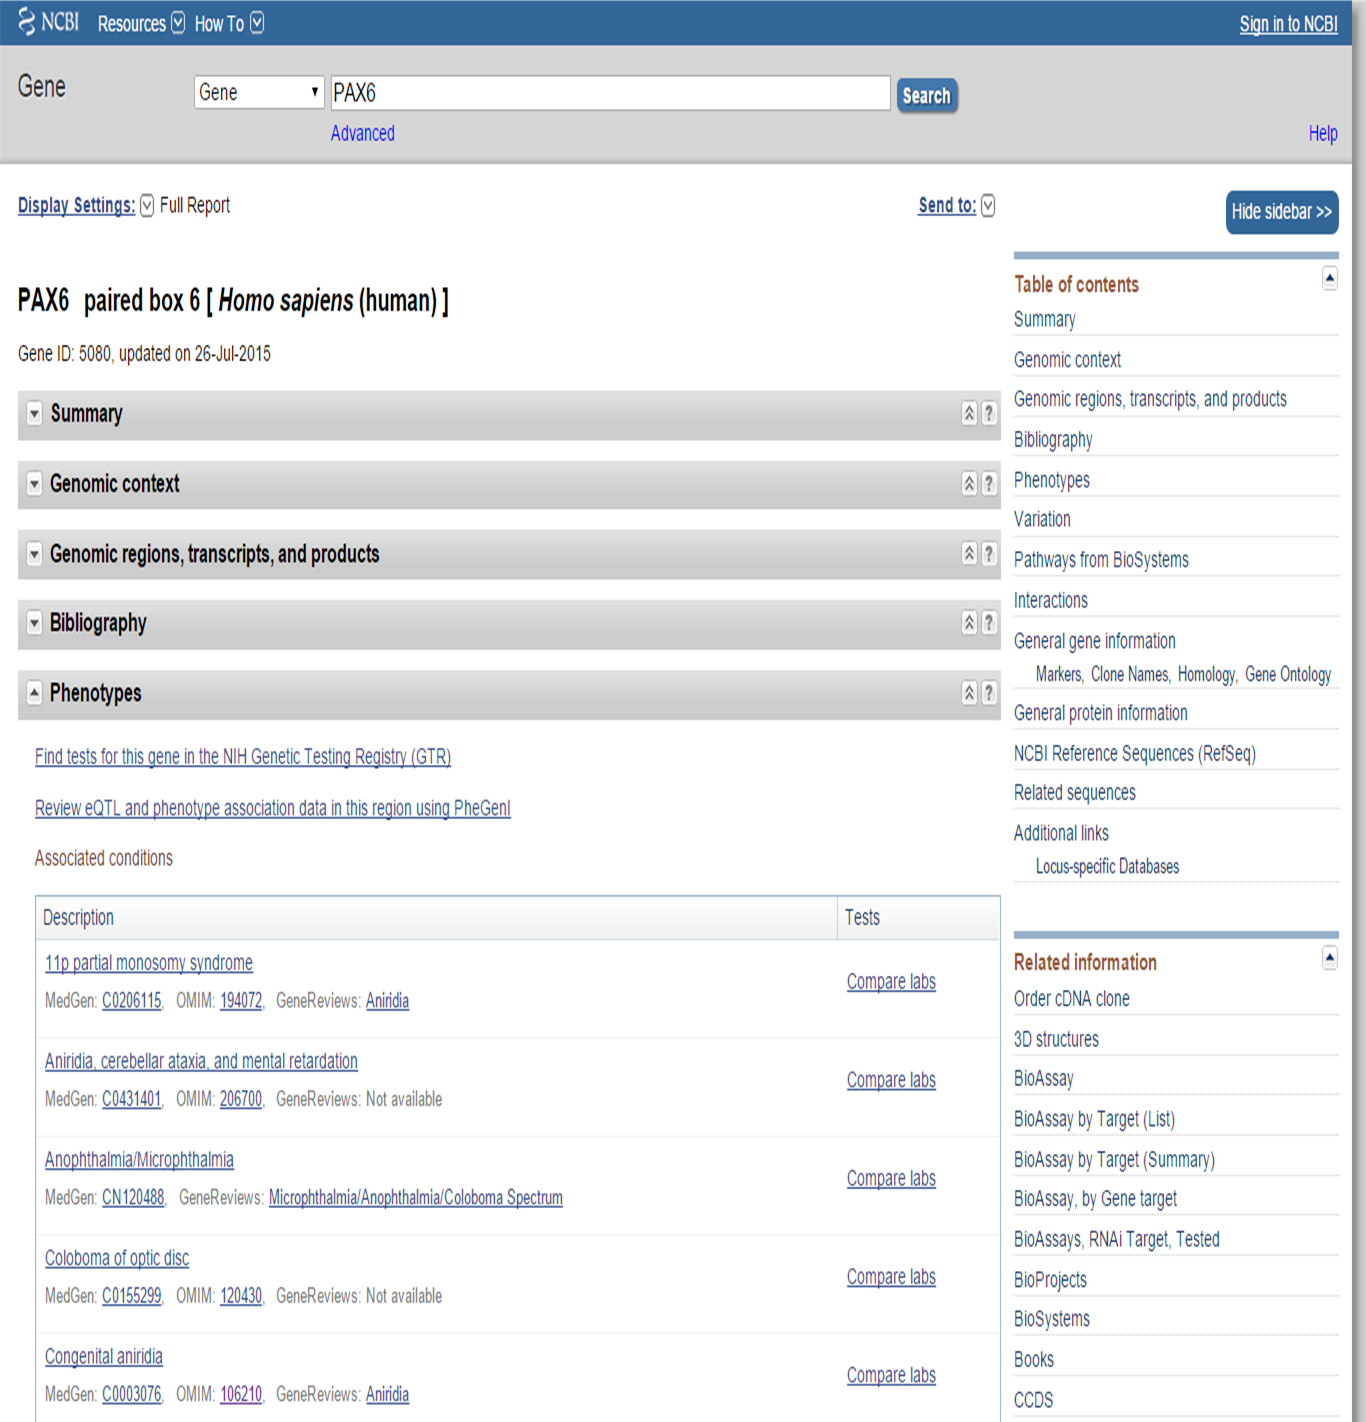
NCBI Gene PAX6 search: phenotype
OMIM also provides some information on the gene associated with the phenotype. This you can access by clicking on the MIM number for the gene/locus.
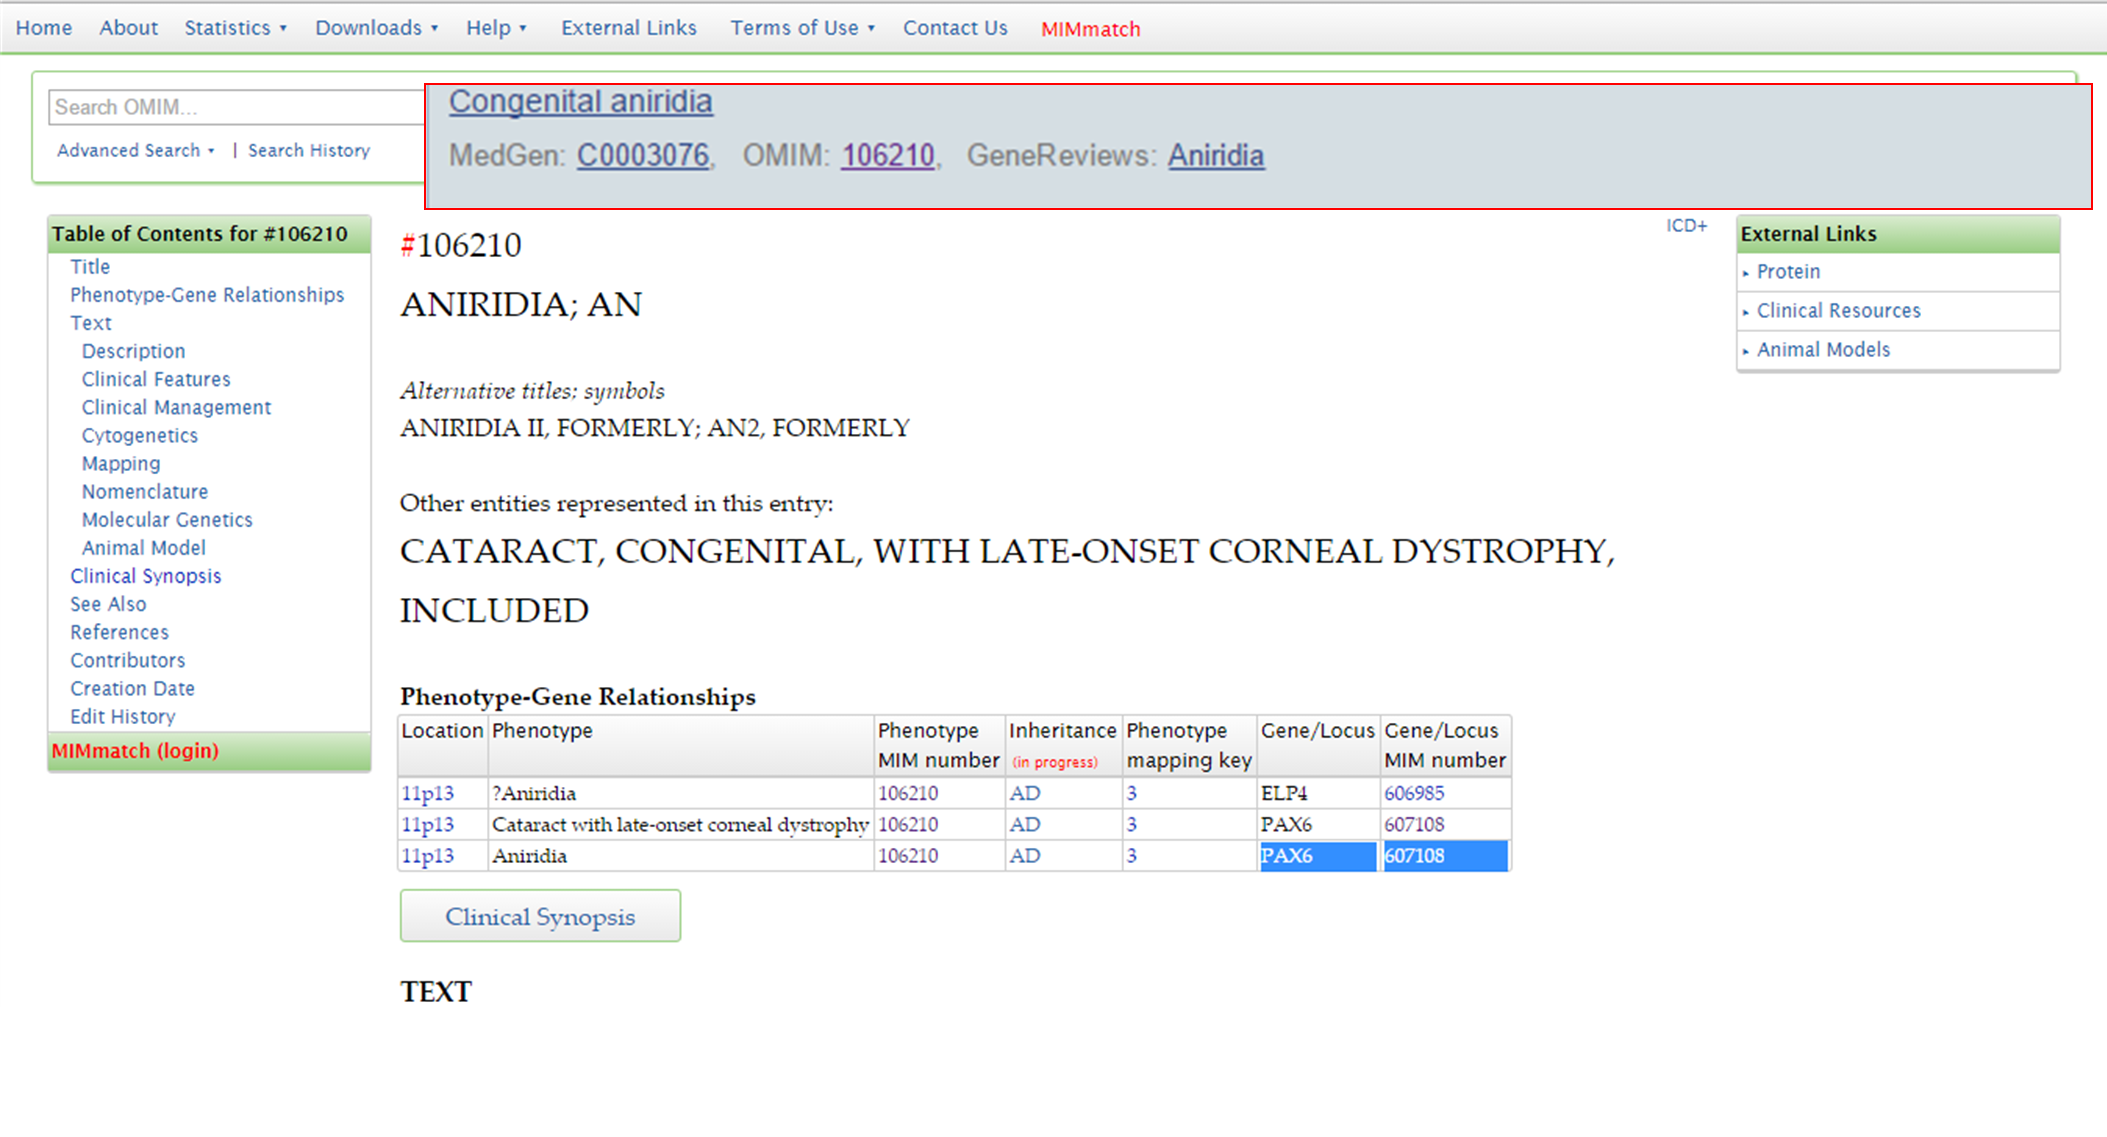
OMIM PAX6 phenotype
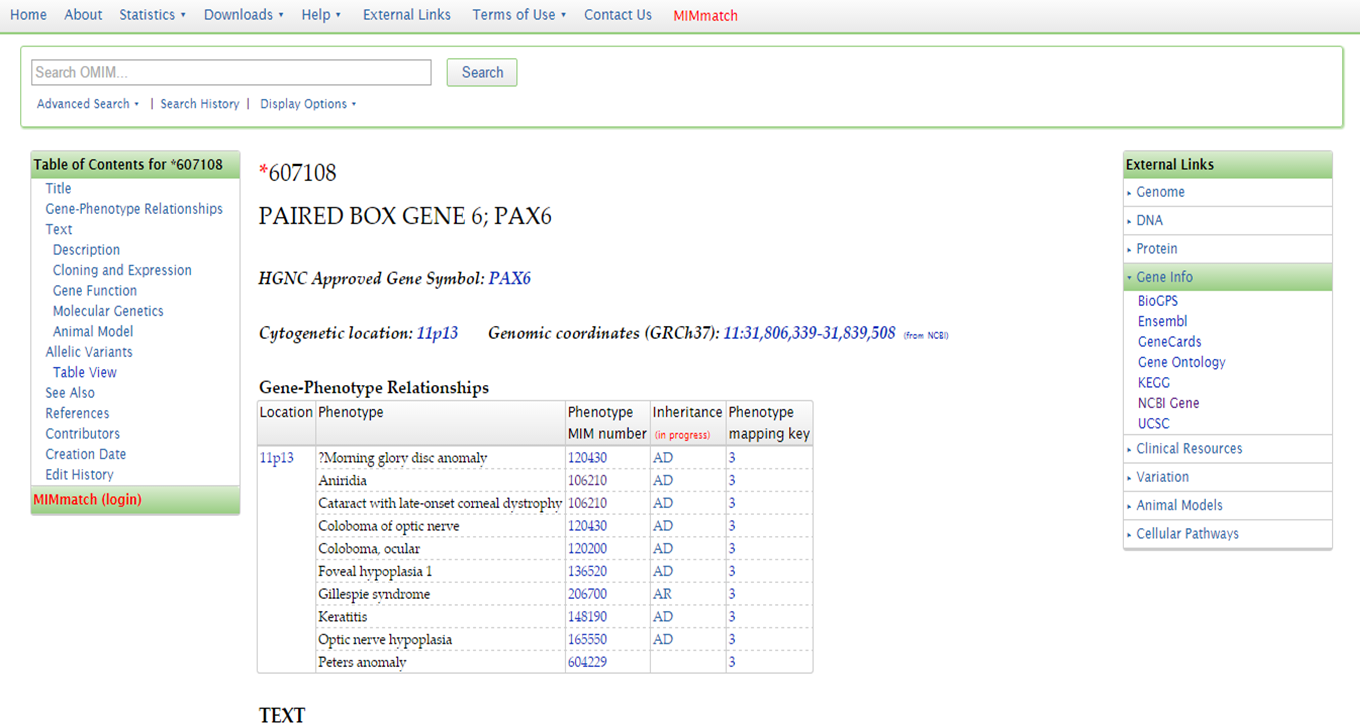
From the OMIM entry for the gene, you can acces additional information in other databases, such as NCBI Gene, UCSC Genome Browser, etc.
OMIM PAX6 additional information
Phenotype information also exists for other species, such as Drosophila Melanogaster.
Searching for the gene 'ey' on FlyBase, allows us to look at the phenotypic data available:
FlyBase gene ey: phenotypes
Such information from model organisms can be useful for studying human diseases. In the case of Drosophila Melanogaster the gene ey, which is homologous to the human Aniridia gene, is found responsible for eye morphogenesis. By targeted expression of this gene, ectopic eye structures were induced on the wings, the legs and on the antennae of Drosophila Melanogaster (Halder G, Callaerts P, Gehring WJ. Induction of ectopic eyes by targeted expression of the eyeless gene in Drosophila. Science 1995, 267(5205):1788-92.).
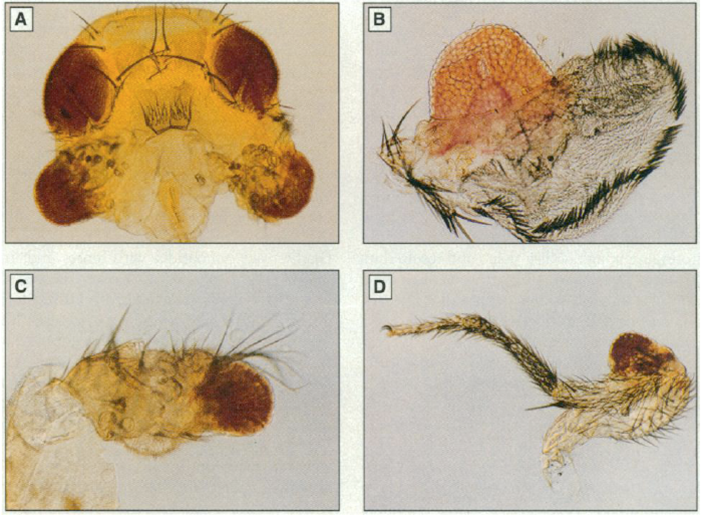 Image retrieved from Halder et al.,1995.
Apart from selecting different species in previously mentioned databases, there are specific model organism databases:
Genome browsers provide a graphical interface for genomic data. One can view many entire genomes (e.g. human, drosophila melanogaster, mouse, etc.) and look through many types of data, such as genes, proteins, single nucleotide polymorphis (SNPs), etc. A typical representation of a genome browser contains a track with genomic coordinates and a genome reference sequence through which the user can interactively move and search for certain regions or genes. Two big players in the genome browser field are the UCSC Genome Browser and the Ensembl Genome Browser.
The UCSC Genome Browser was produced by the Genome Bioinformatics Group at the University of California, Santa Cruz (http://genome.ucsc.edu/). Genomic annotations are represented in the form of tracks. Each track contains a different type of feature/data type such as genes, CpG islands, SNPs, etc. Tracks can be created by the UCSC Genome Bioinformatics team or be provided by other groups working in the bioinformatics field. Many different species are available in the UCSC Genome Browser and therefore, many tracks are species specific.
Let's go to the UCSC Genome Bioinformatics website and take a closer look:

UCSC Genome Bioinformatics homepage
As you can see on the homepage the UCSC Genome Bioinformatics Group provides much more than only a genome browser. Besides the graphical representation, the UCSC Genome Browser, they have also created an easy interface, the UCSC Table Browser, to retrieve the data behind this graphical interface. The UCSC Genome Bioinformatics Group also provides multiple tools, such as BLAT (see Chapter 6 on alignments), in silico PCR for creating a theoretical PCR (ideal for checking if your PCR primers will work!), LiftOver to convert genomic coordinates and genome annotation between different assemblies, etc.
On the homepage, clicking:
Genomes: will redirect you to the UCSC Genome Browser search page
Genome Browser: will redirect you to the UCSC Genome Browser itself
On the Genomes page we can the Genome Browser by gene symbol, genomic location or by a term (e.g. 'cell cycle') which will lead to an overview of genes involved in 'cell cycle'.
UCSC Genome Browser search
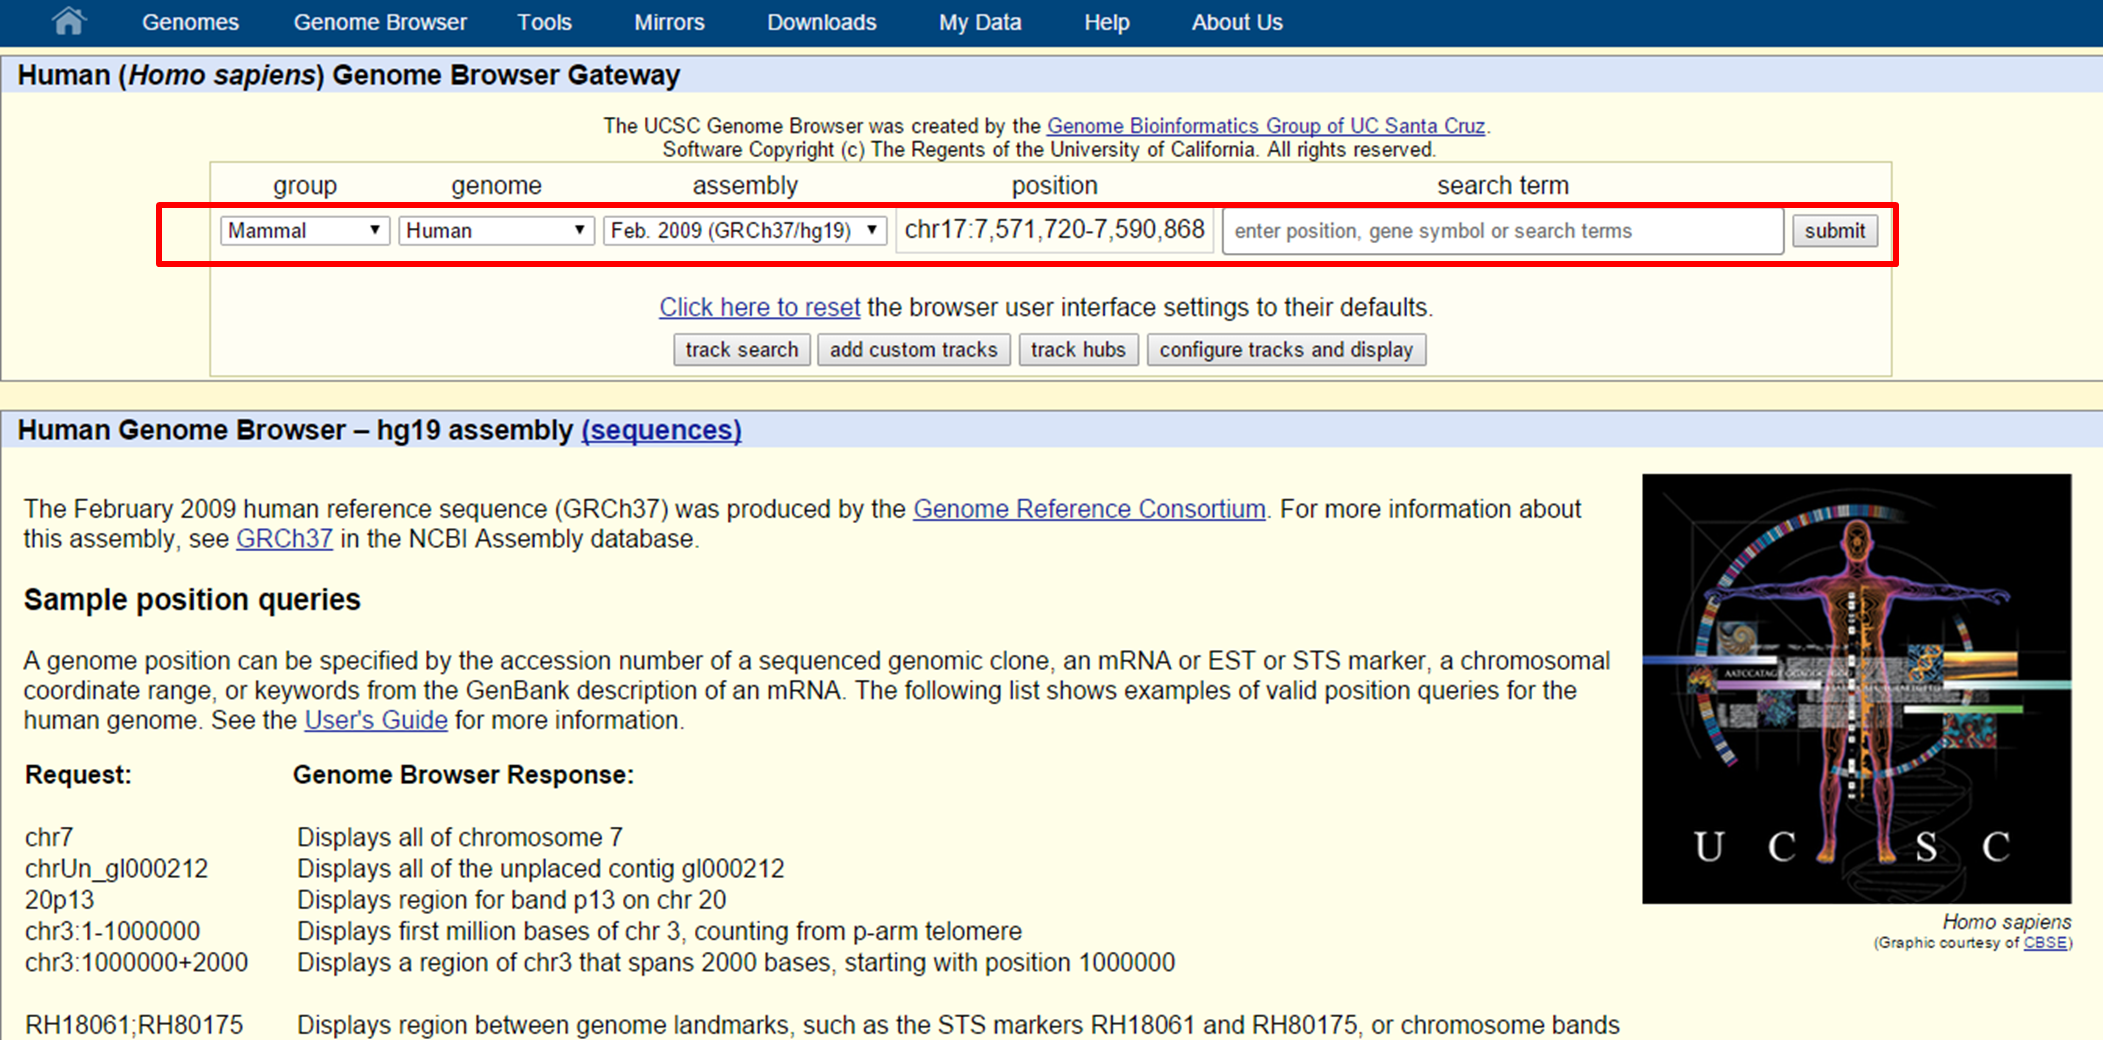
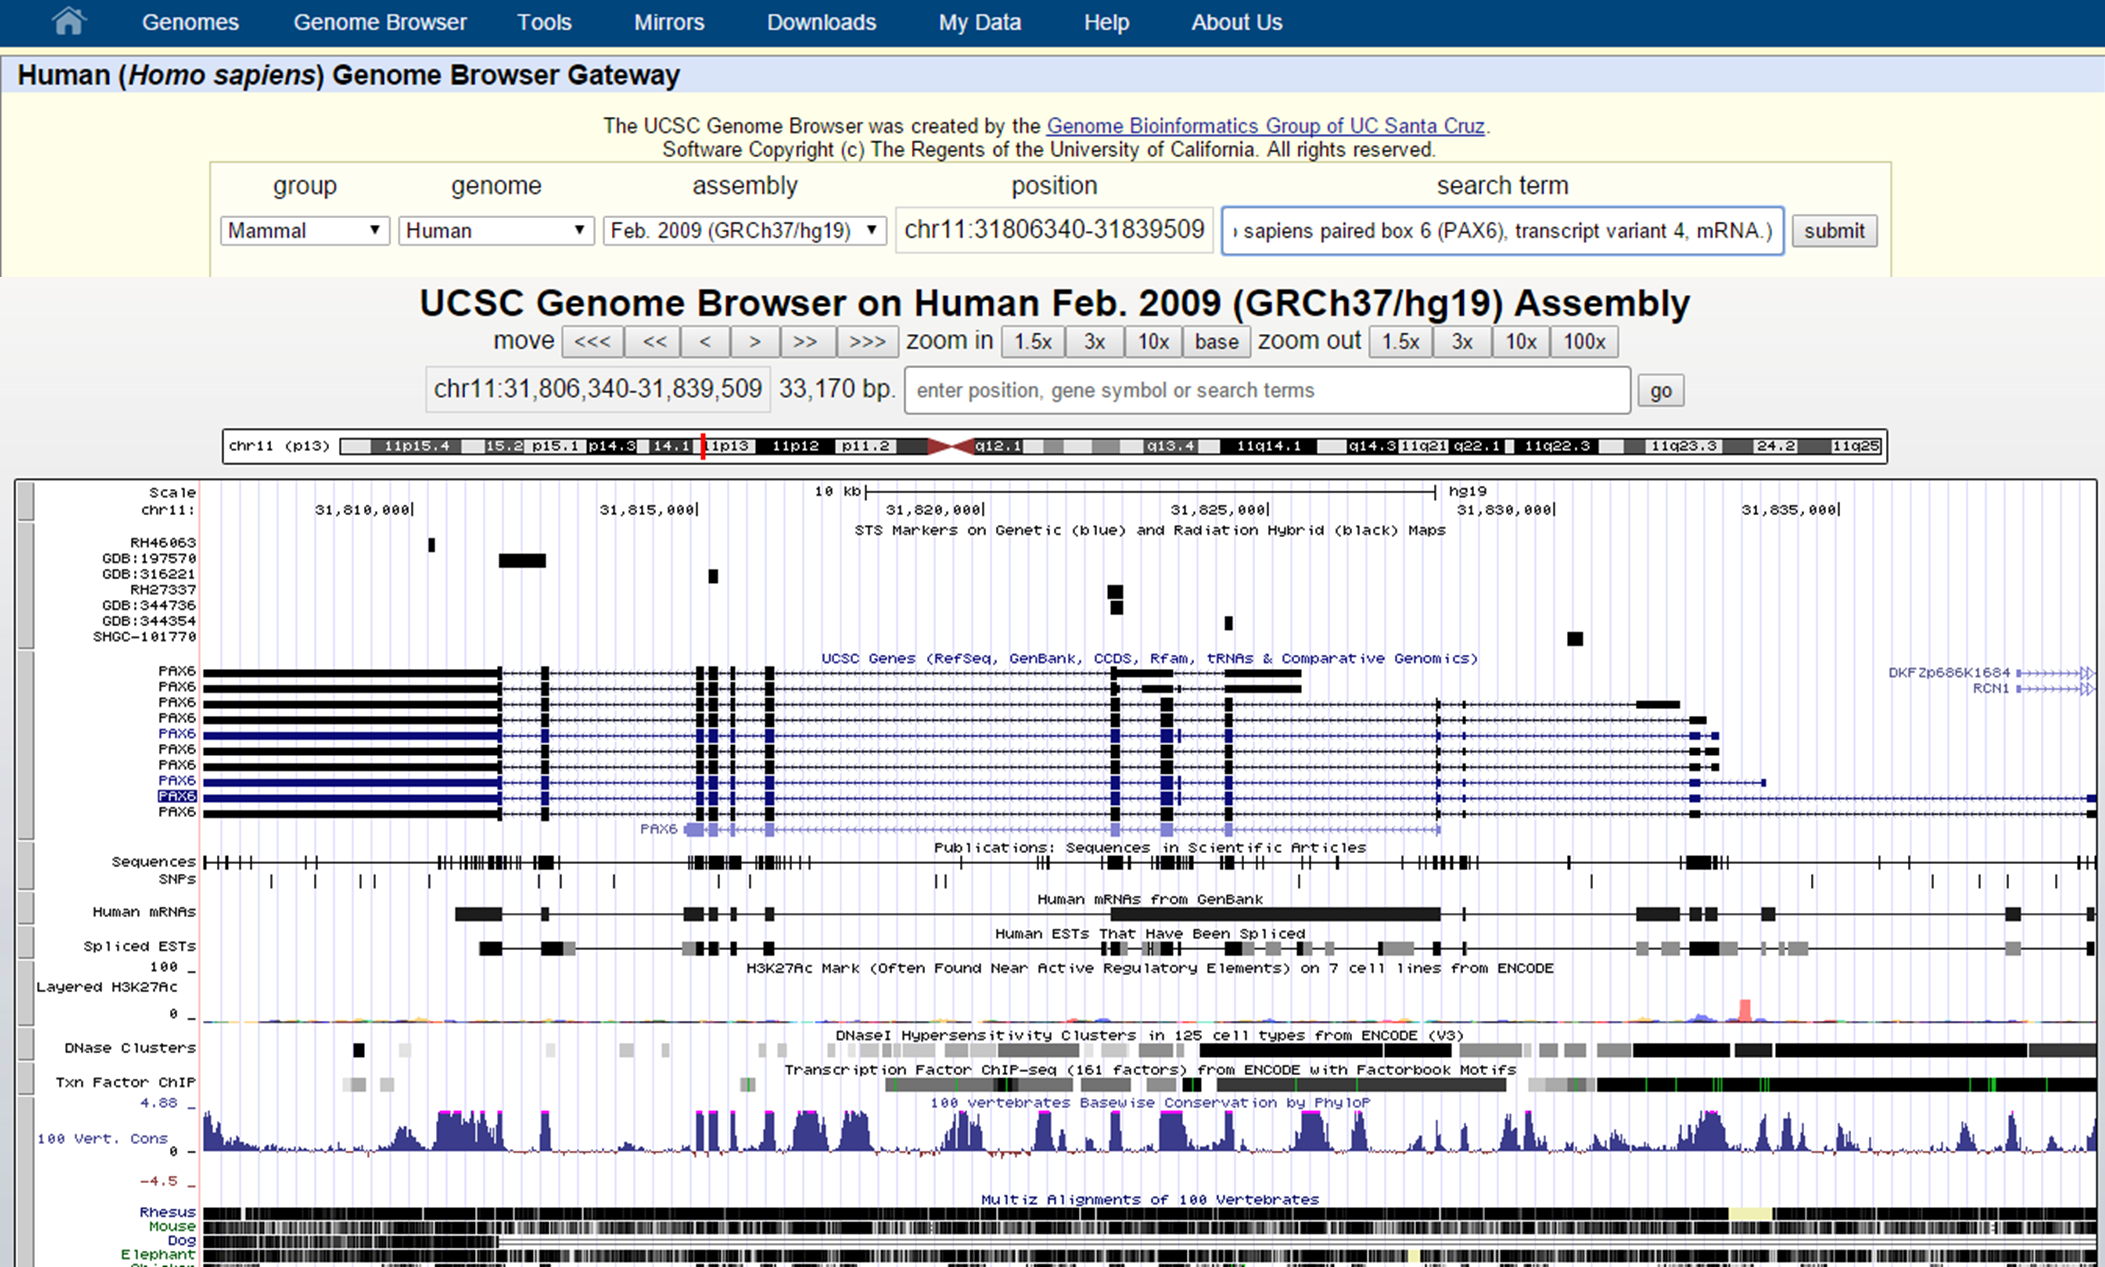
Let's try searching for the PAX6 gene...
UCSC Genome Browser search
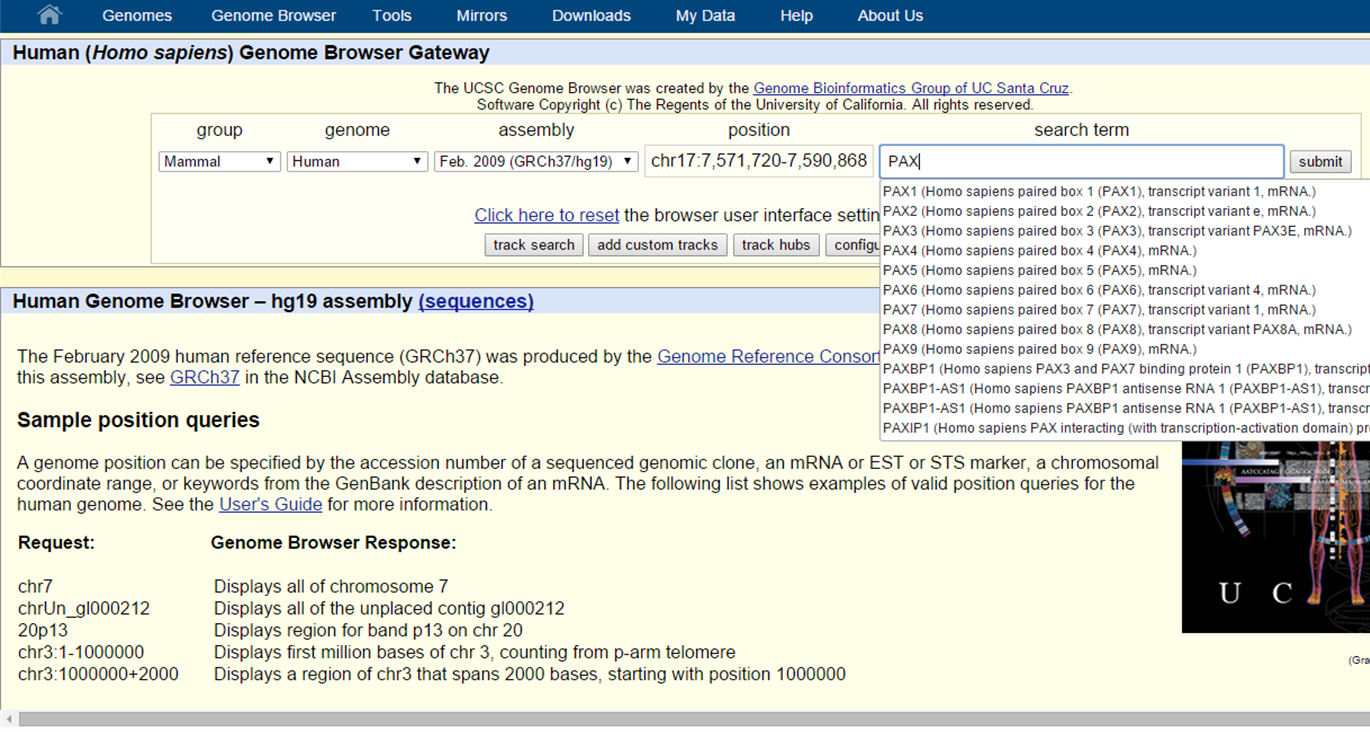
... an autofill search window pops up to help you what you are looking for. For PAX6 we see transcript variant 4 in the list. Clicking on this search result and selecting Submit will redirect you to the graphical view of the Genome Browser for PAX6 transcript 4. Since PAX6 has multiple transcript variants, we might want to find transcript variant 1. In that case, just fill in PAX6 in the search box and click submit.
UCSC Genome Browser search
This will lead you to a list of search results, where you can find the multiple transcripts for PAX6. Select the correct one by clicking on the link and this will redirect you to the graphical view in the Genome Browser.
UCSC Genome Browser search
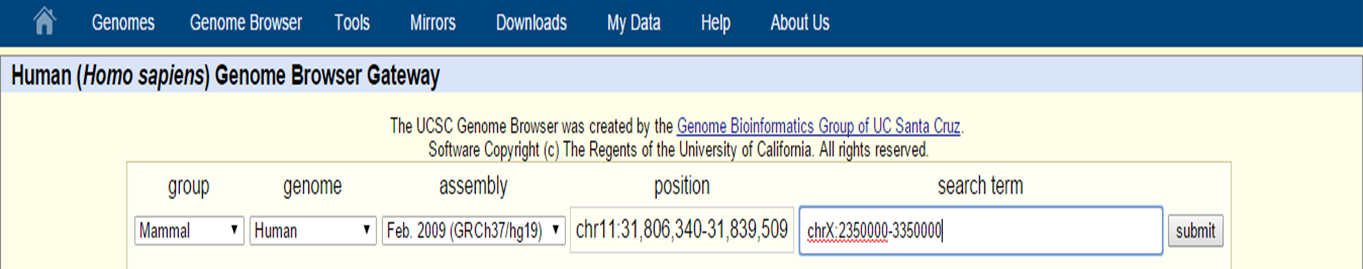
If you want to look at a certain genomic region, specify a genomic location in the search box with the following format: chrN:startposition-stoppostion
A full chromosome can also be made visible by just specifying the chromosome number in the search box (e.g. chr10).
UCSC Genome Browser search
Now look at the Genome Browser view of the PAX6 gene (transcript variant 4):
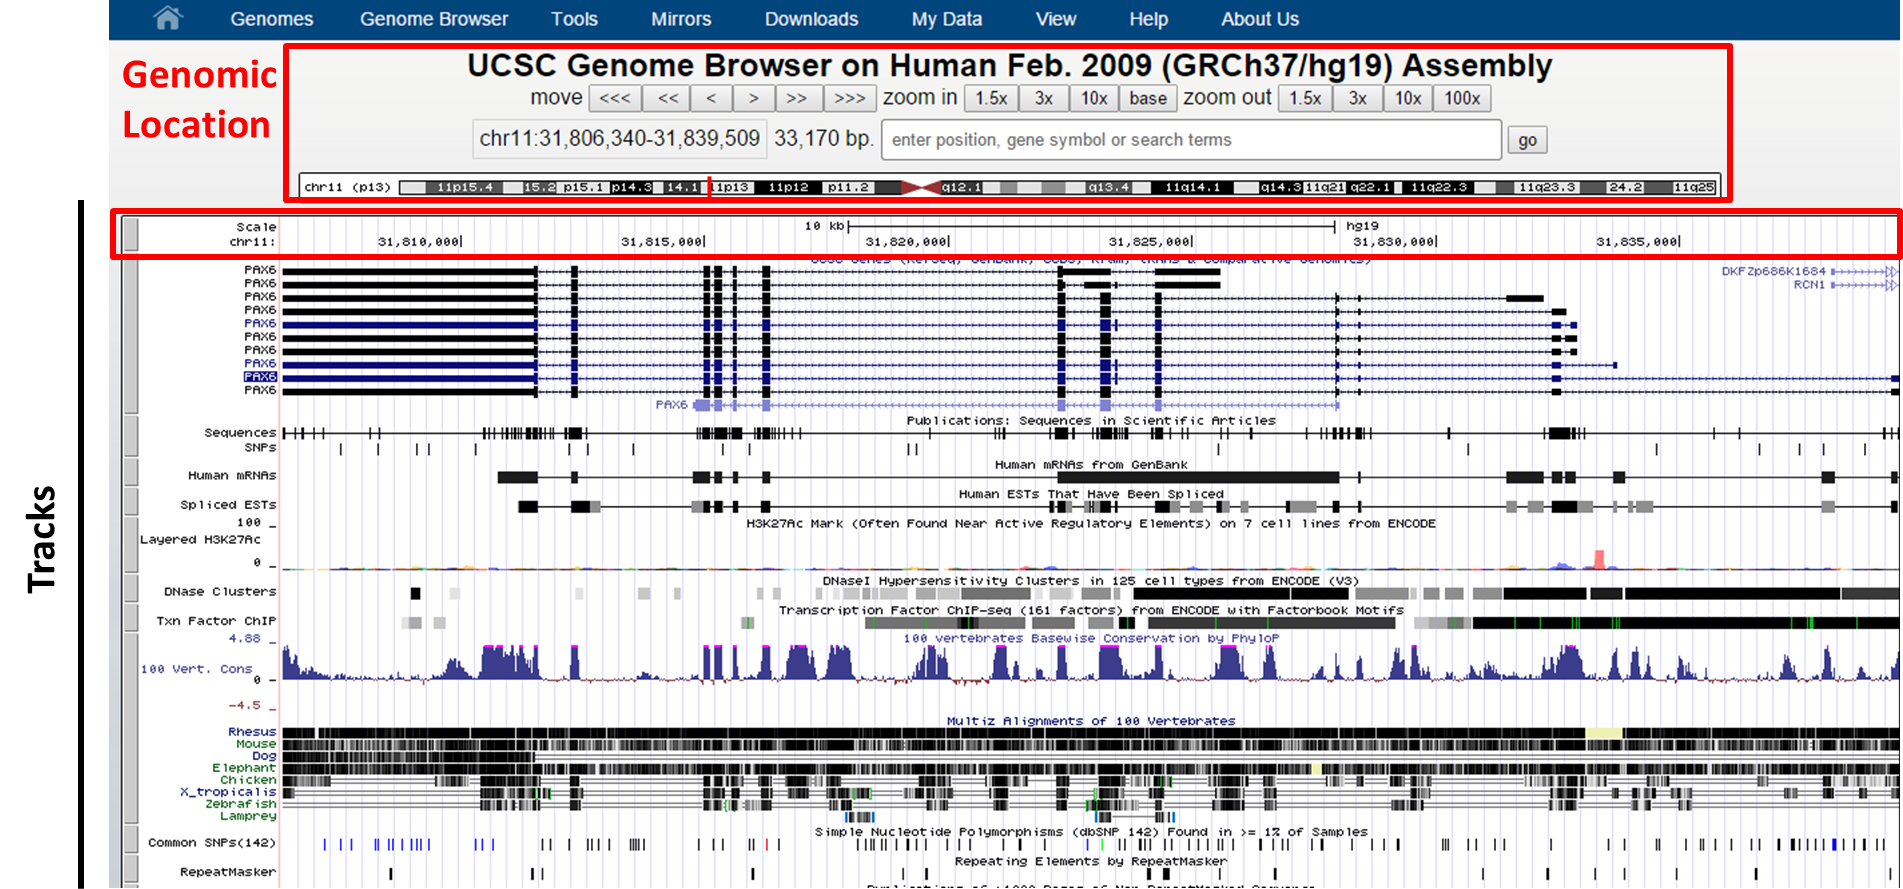
UCSC Genome Browser interface
At the top you can find your exact genomic location in coordinates and a graphical view of your location on the chromosome. With the move buttons you can scroll left and right (with different intervals for each button) through the whole chromosome you are located on now. It is also to zoom in and out from your current genomic location with the zoom buttons on different scales (1.5X, 3x, 10x, 100x). Zooming in to the basepair resolution can be done by clicking the button Base. This will show you in the top track the nucleotide sequence of the reference genome (here: hg19 assembly).
Beneath the basepair track we can find other tracks, such as UCSC Genes, Sequences (sequence as is found in literature), SNPs, Repeatmasker (displays the repeats in the genome), etc.
Tracks can be managed through scrolling down on the page and selecting the desired tracks in 'control centre' of the tracks:
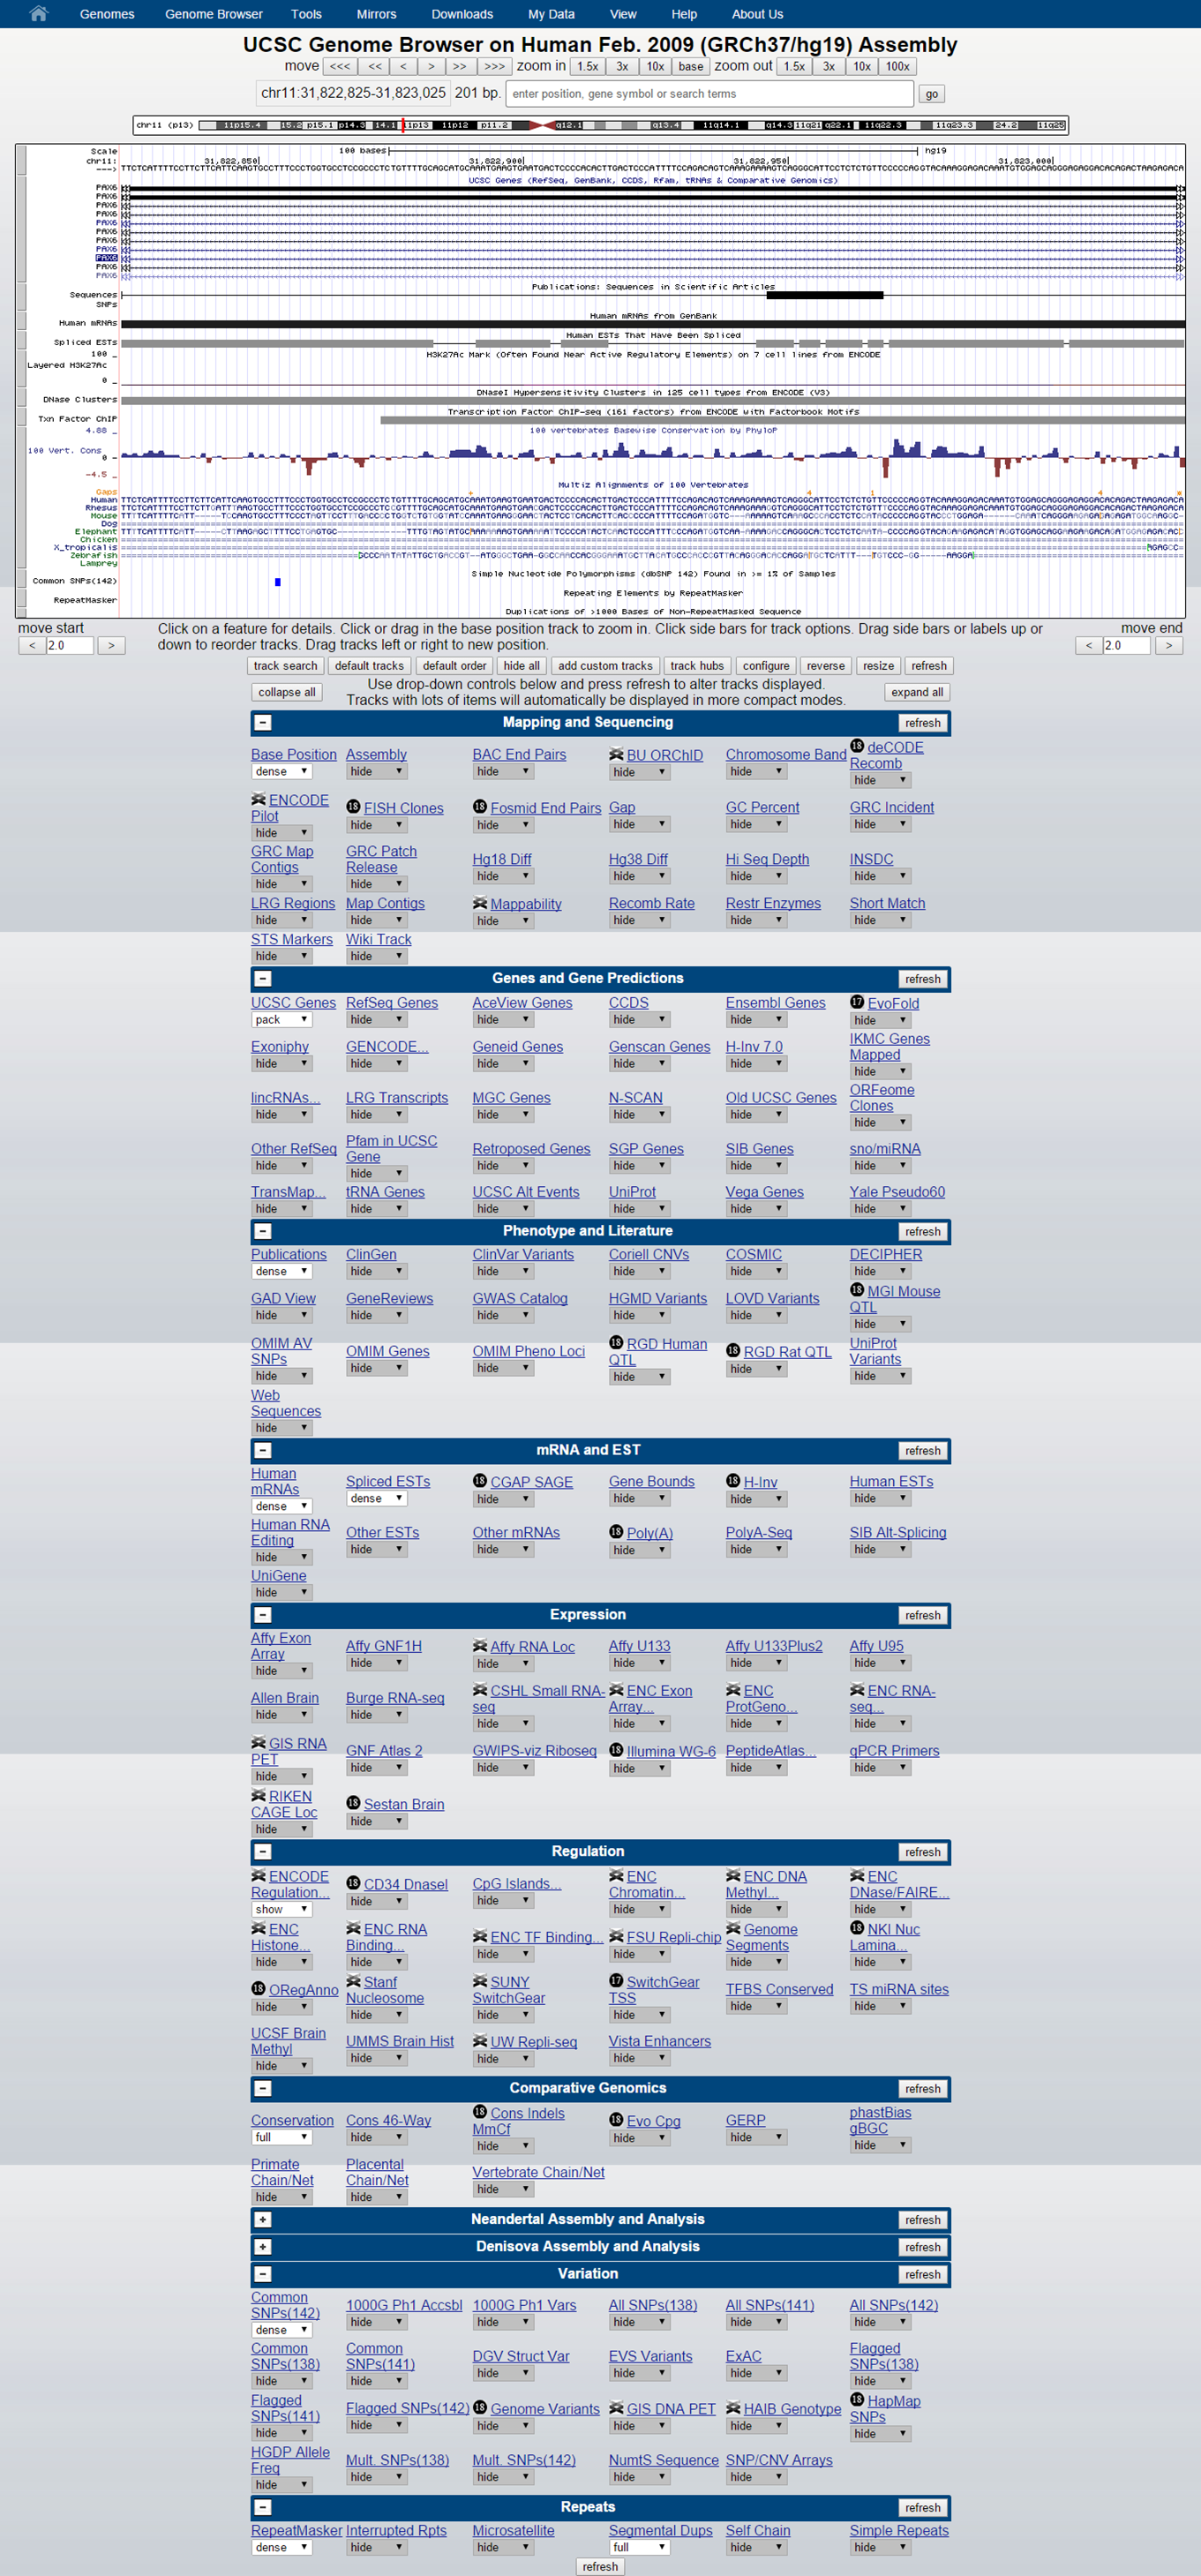
UCSC Tracks
Here, you can find categories such as Mapping and Sequencing, Genes and Gene prediction, Repeats which contain multiple tracks to set.
Clicking on the track name will lead you to a description of the track. Some tracks can be filtered for their output (e.g. mRNA and EST > Human ESTs). This can be done by also clicking on the track name. Displaying the track can be done by selecting the dropdown menu:
Let's say besides UCSC Genes, we also want to display Ensembl Genes.
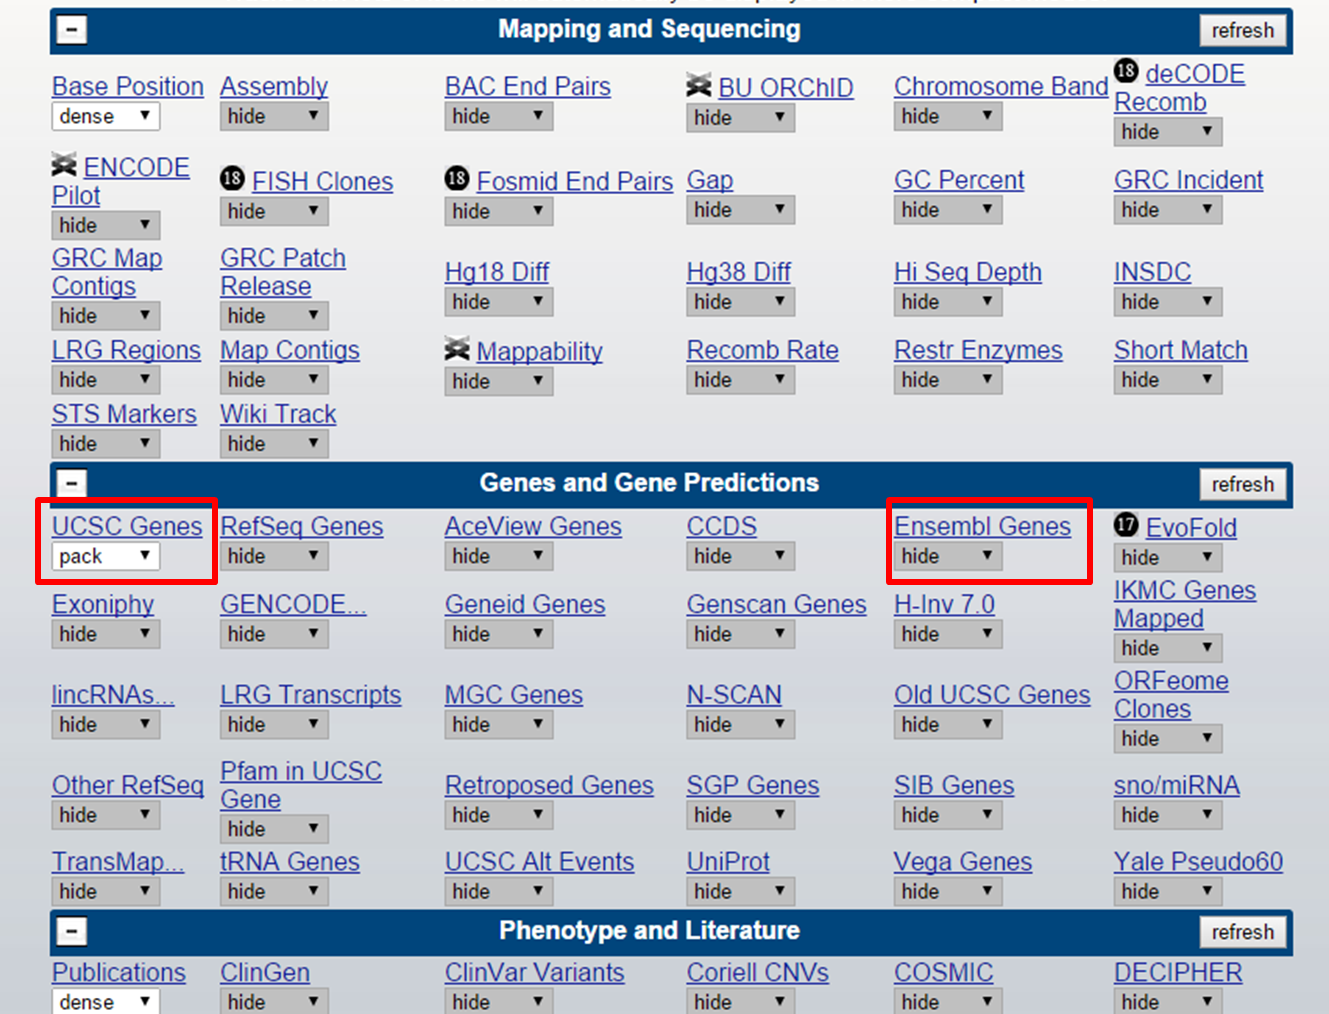
UCSC track setting
A track is active when it is not set to 'hide'. But there are multiple forms in which a track can be active:
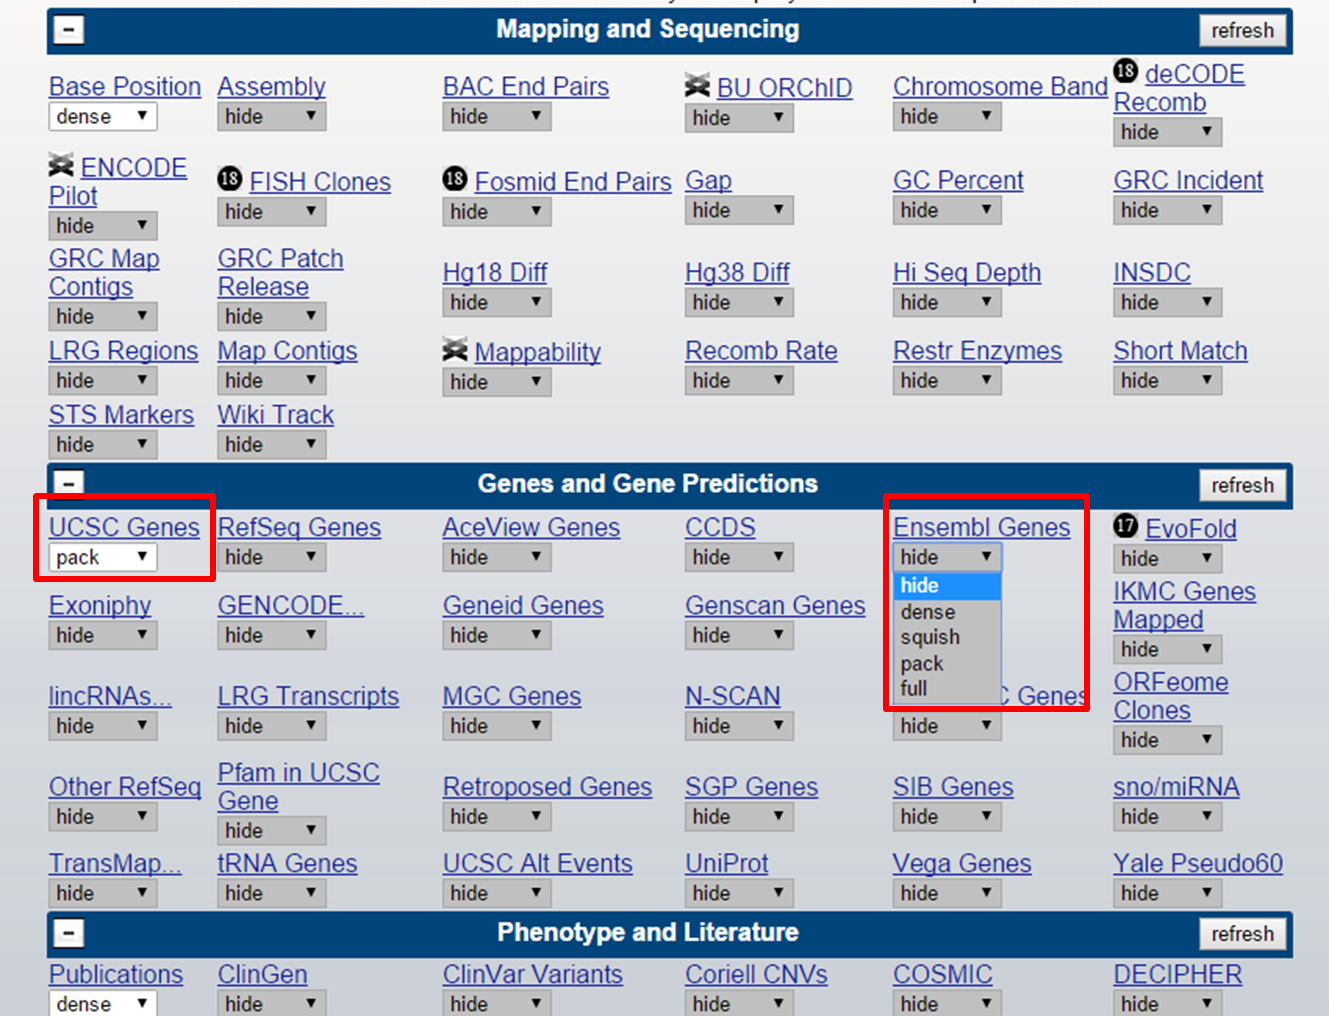
UCSC track setting
hide: track is not active
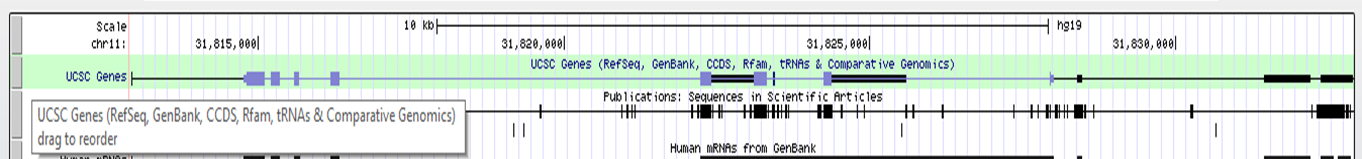
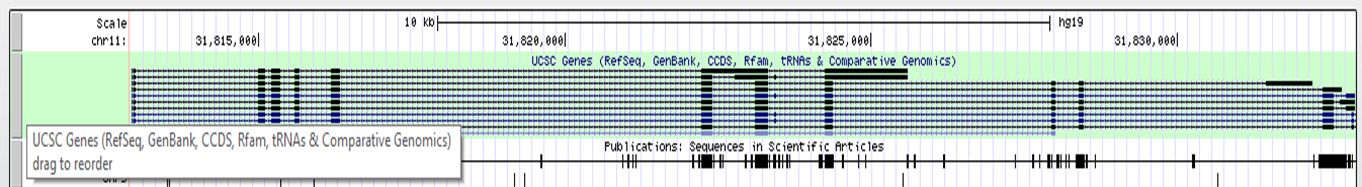
dense: displays all items on a single line
UCSC track dense
UCSC track squish
UCSC track pack
UCSC track full
After setting the correct form for the track to show, click 'refresh' to make your changes active.
Under the graphical view of the Genome Browser, you can adjust display settings by clicking configure, resize (to current window size), etc. Reverse will flip the Genome Browser from 5'-3' to 3'-5' view. Also track order can be set here.
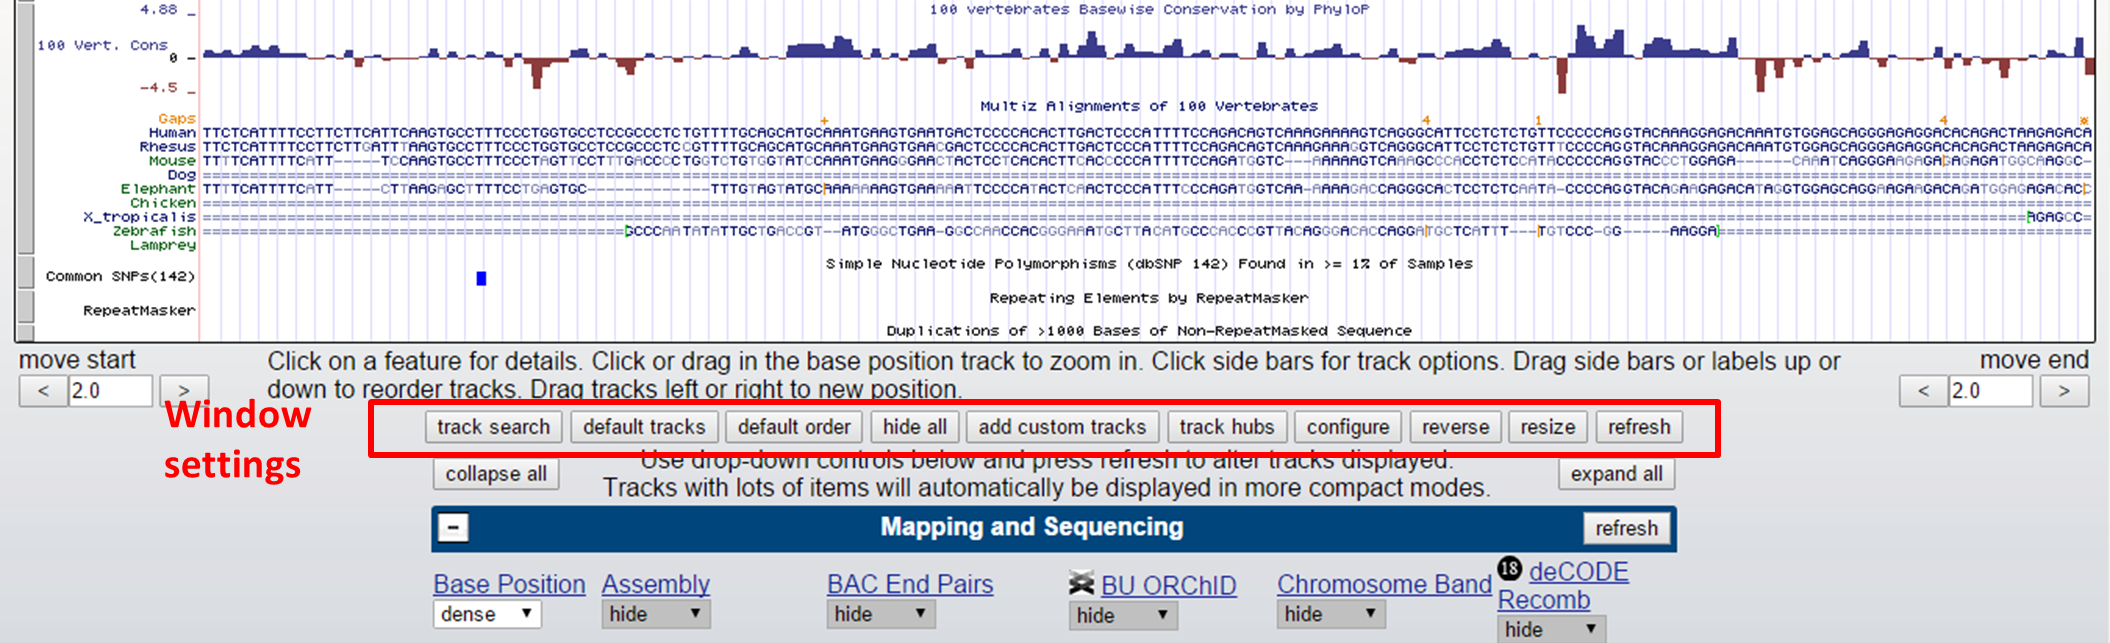
UCSC Genome Browser settings
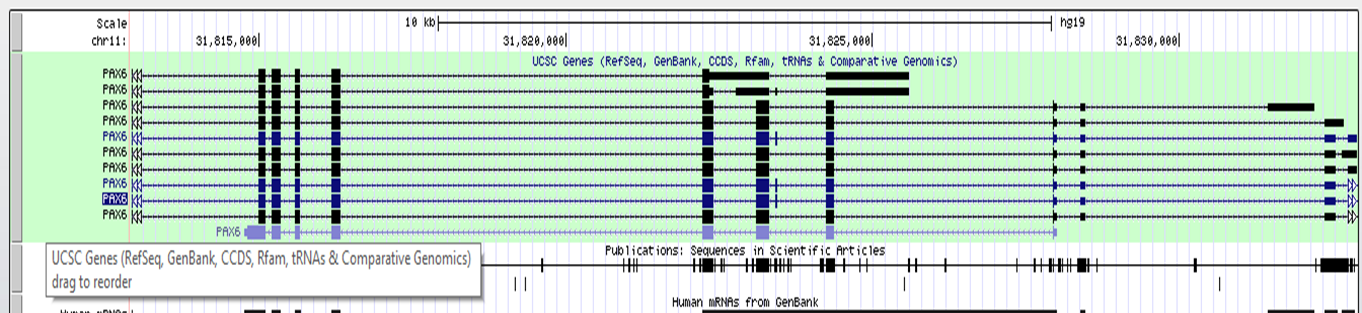
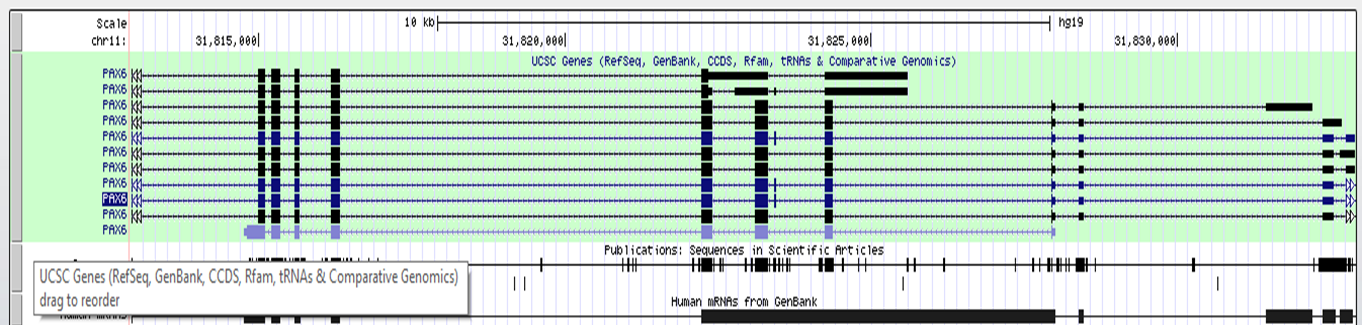
The structure (exons, introns, UTRs) of a gene transcript can also be viewed in the Genome Browser.
Here, you can find a schematic representation of a gene structure:

UCSC Gene structure
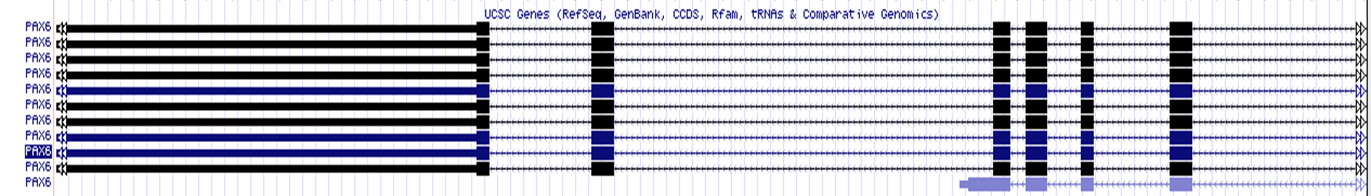
UCSC Gene structure
For more information on an item in the Genome Browser, click on it! It will redirect you to a description page, where you can find a lot of information. For example clicking on a PAX6 transcript in the UCSC Genes track, gives you:

UCSC Genome Browser item info
Here, you can find information on the gene such as number of exons, length, microarray data, etc. Also you can retrieve the sequence of the gene by clicking the 'Genomic Sequence' link:
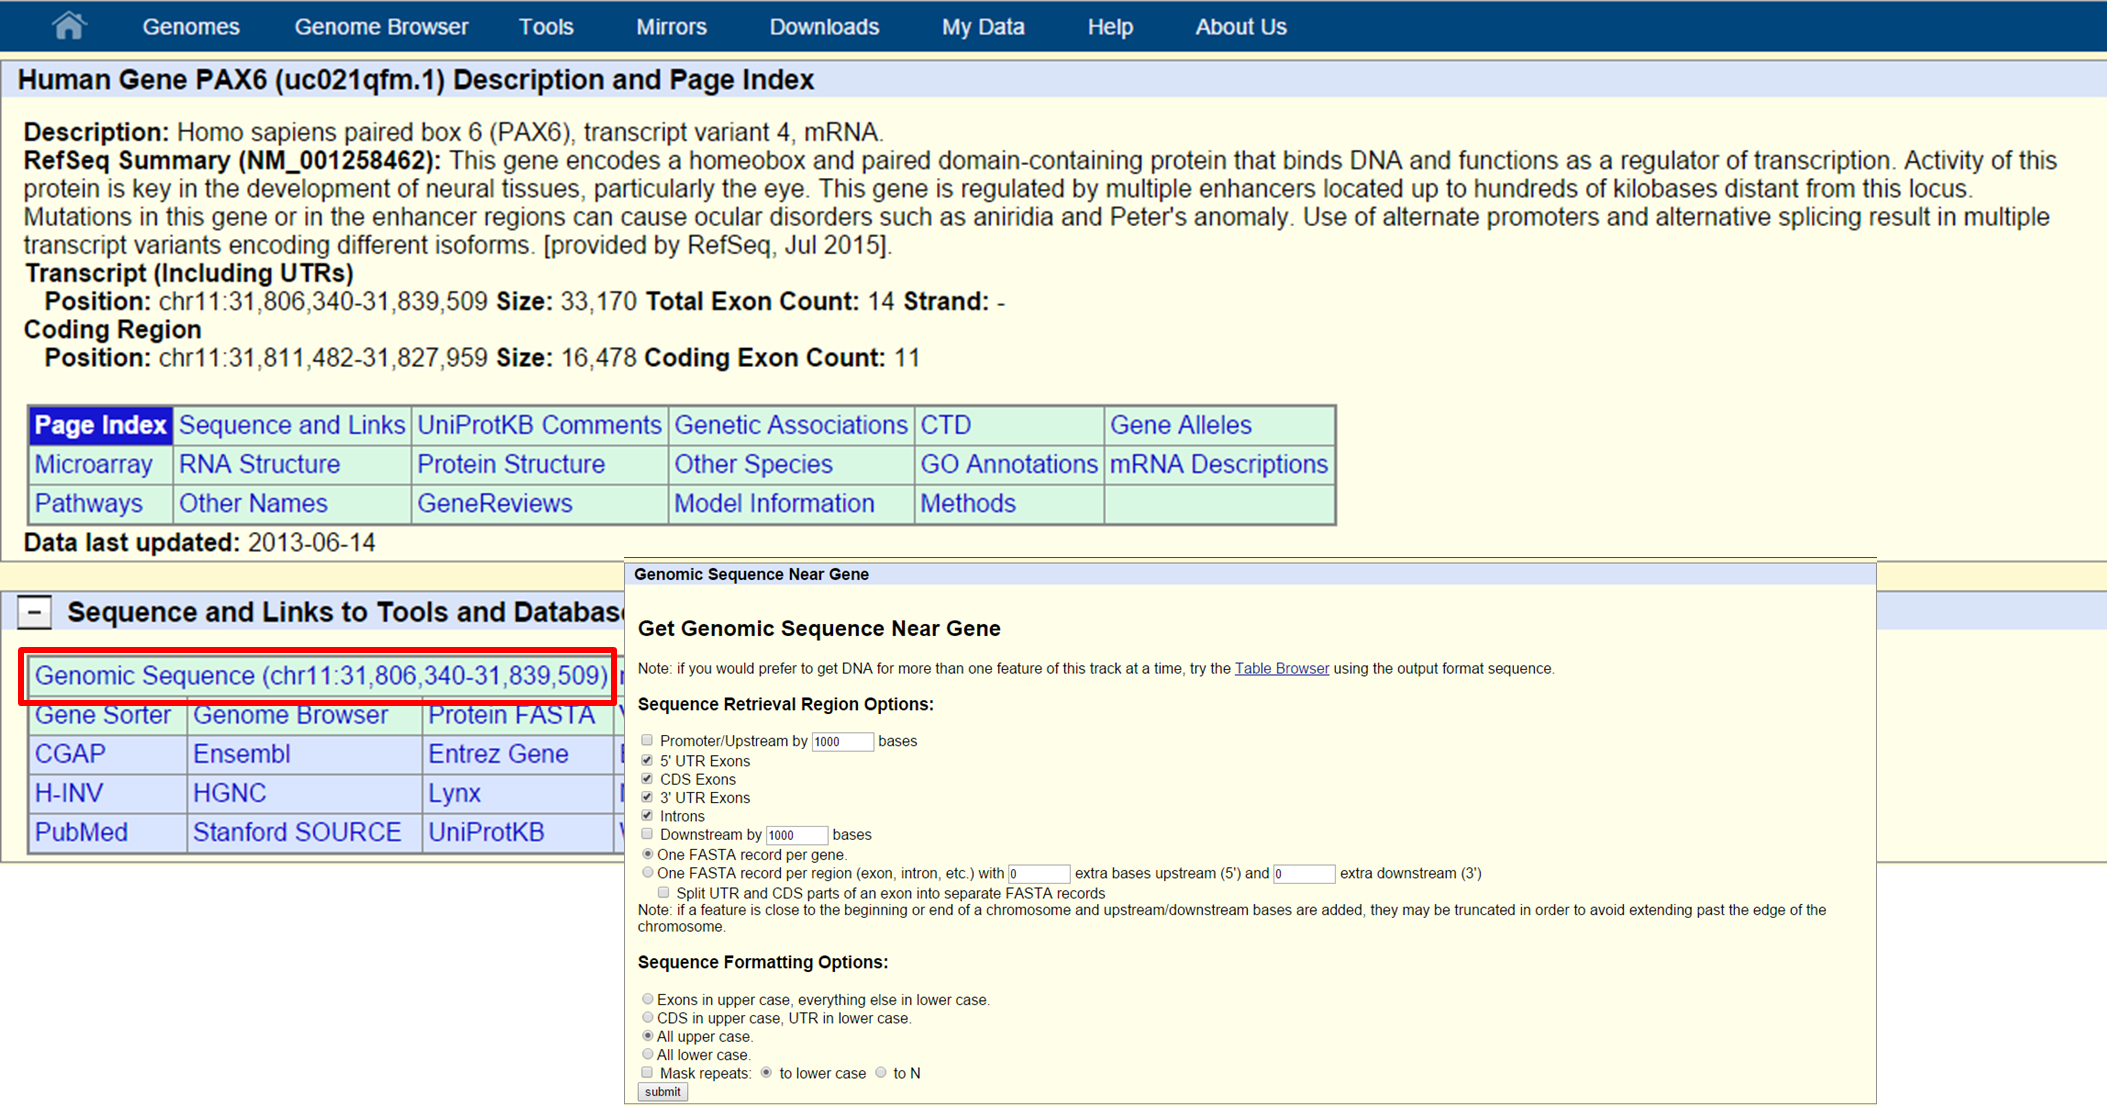
UCSC Genomic Sequence retrieval
In the Genome Browser itself, you can also retrieve the genomic sequence for a certain genomic interval:
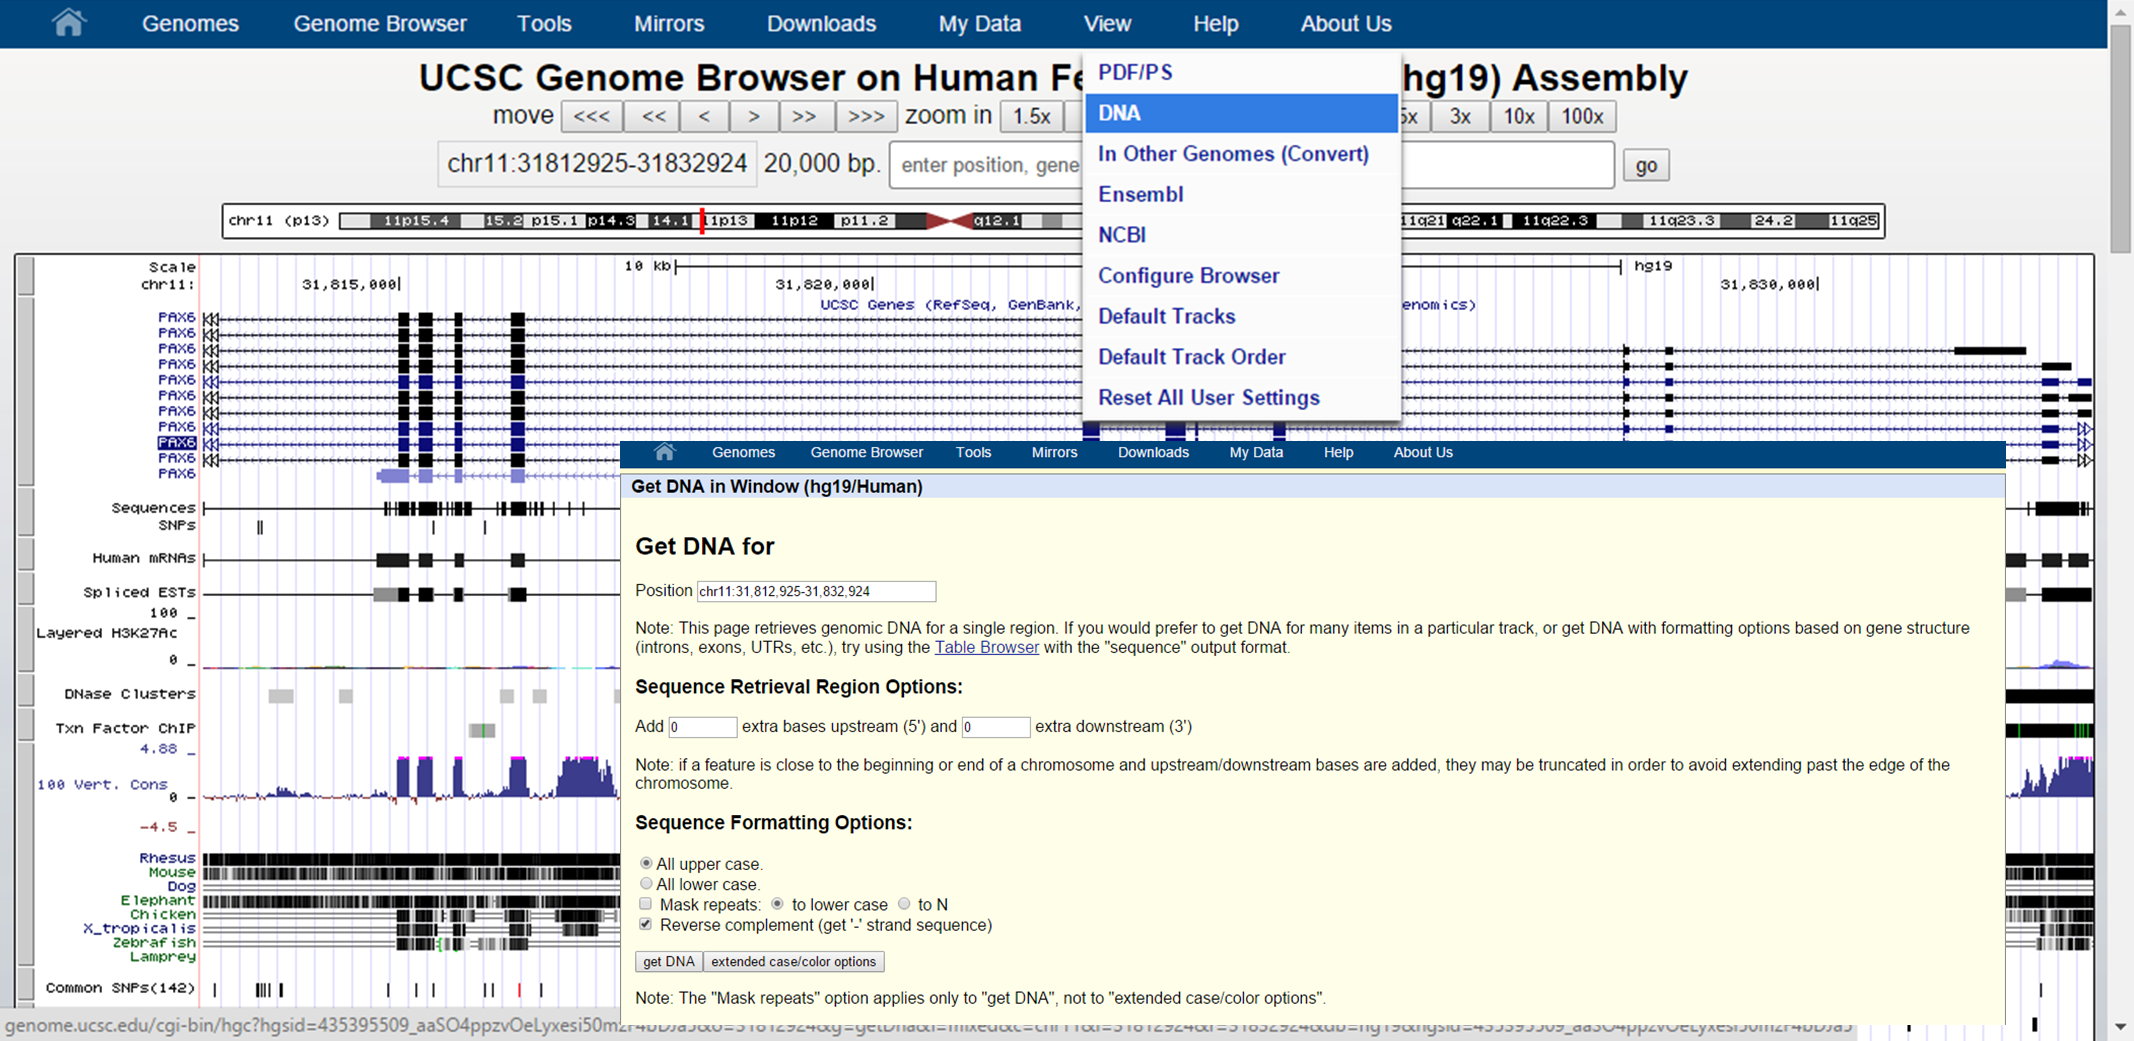
UCSC Sequence retrieval
Hints and tricks:
Exercise 1.9. UCSC Genome Browser: data search, using tracks and tools
Exercise 1.10. UCSC Genome Browser: data search, using tracks and tools
By selecting Table Browser on the UCSC Genome Bioinformatics homepage, you can retrieve the data behind the Genome Browser (from the tracks) in text format, such as DNA sequence, exons of a gene, etc.
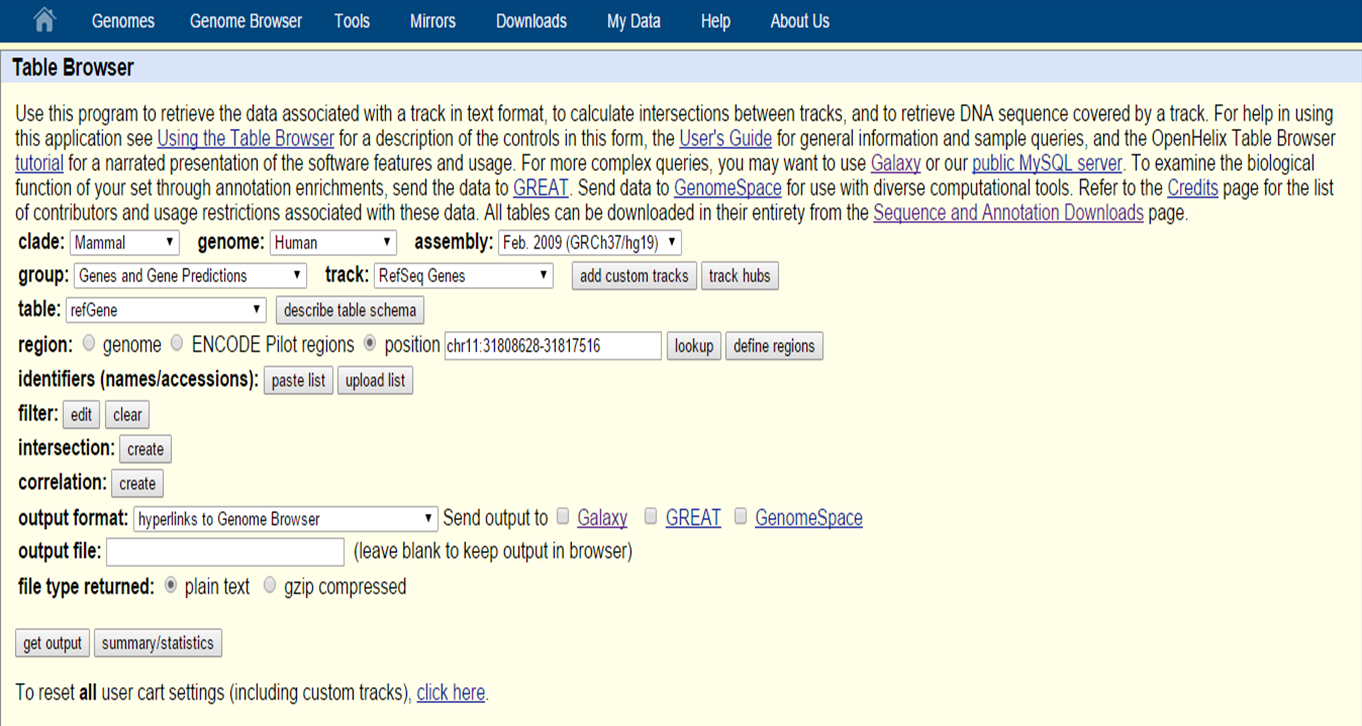
UCSC Table Browser
In the Table Browser, as with the Genome Browser, you can select the species type and genome assembly version.
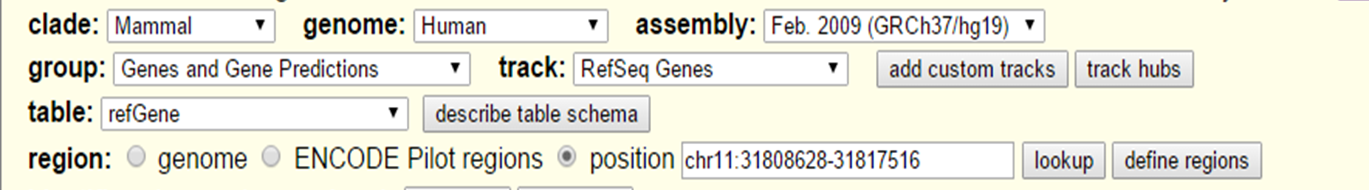
UCSC Table Browser search
With 'group', 'track' and 'table' you can select the data that is needed. For example in the group 'Repeats' extract the data from the track Repeatmasker. Table lets you decide which data table you want, if there are multiple possibilites. In the 'Region' section you can select whole genome or you can specify a location.
On the data you can also apply filters to only retrieve a specific subset of data (e.g. name, chromosome, strand,exonCount, etc.). Identifiers (names and accession numbers) can also be specified.
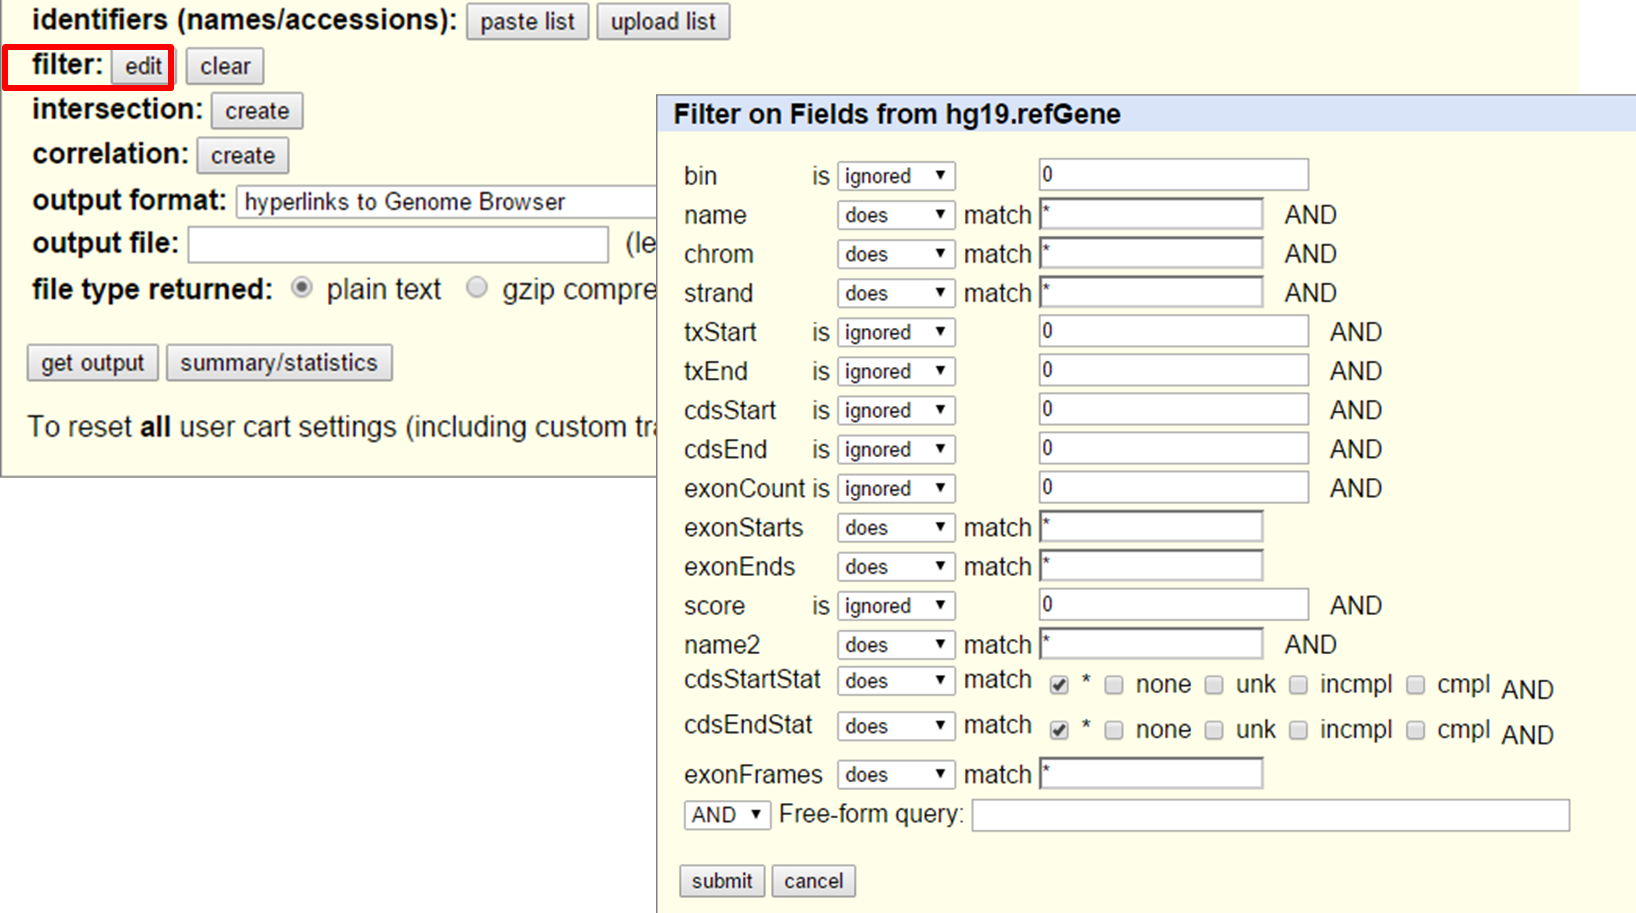
UCSC Table Browser search and filter
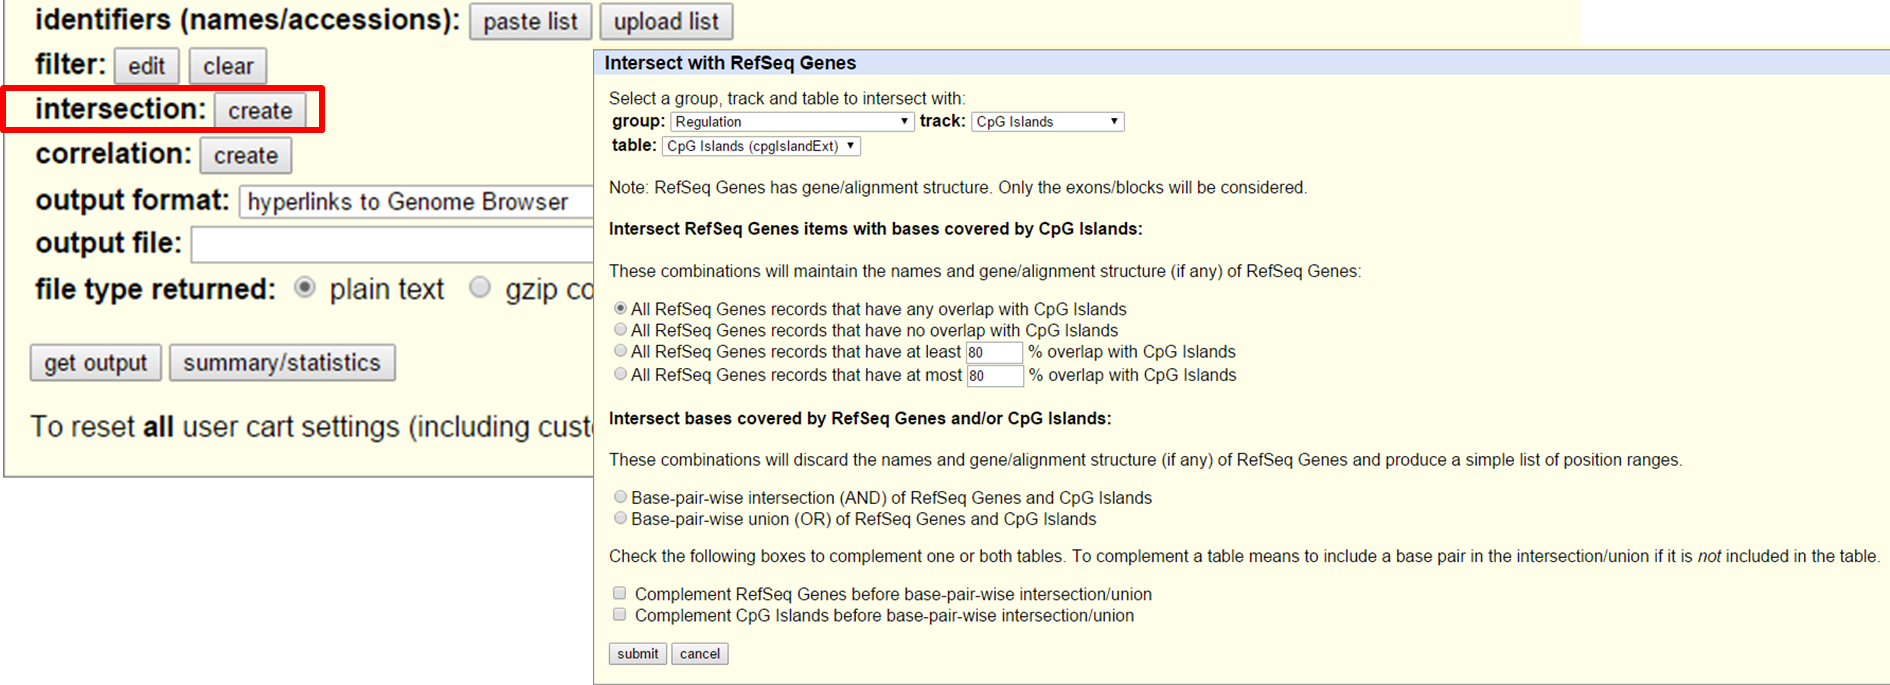
The Table Browser also gives to opportunity to intersect two datasets, e.g. CpG islands in RefSeq Genes on chromosome 7.
UCSC Table Browser search and intersection
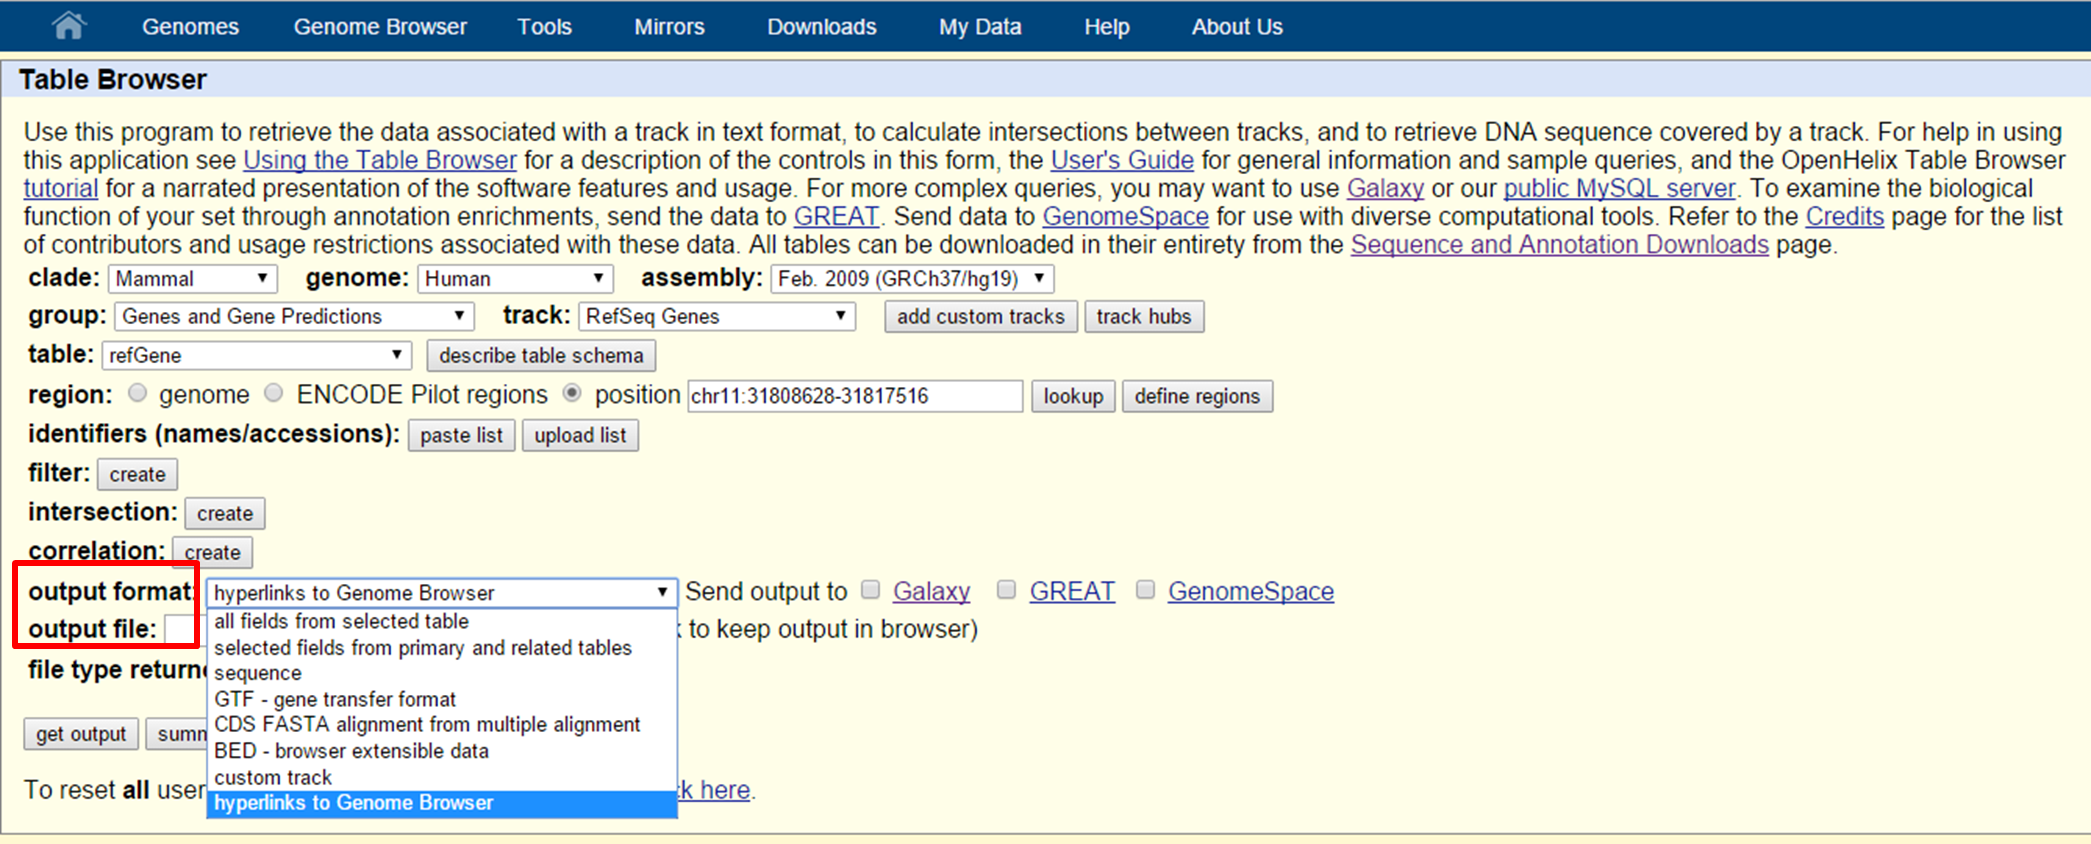
To obtain the data: select an output format, define an output file name and press 'get output'.
UCSC Table Browser search and intersection
The main output formats are:
You can also upload your own data to visualize in the UCSC Genome Browser by selecting 'Custom tracks' on the homepage or by 'add custom tracks' in the Genomes page.
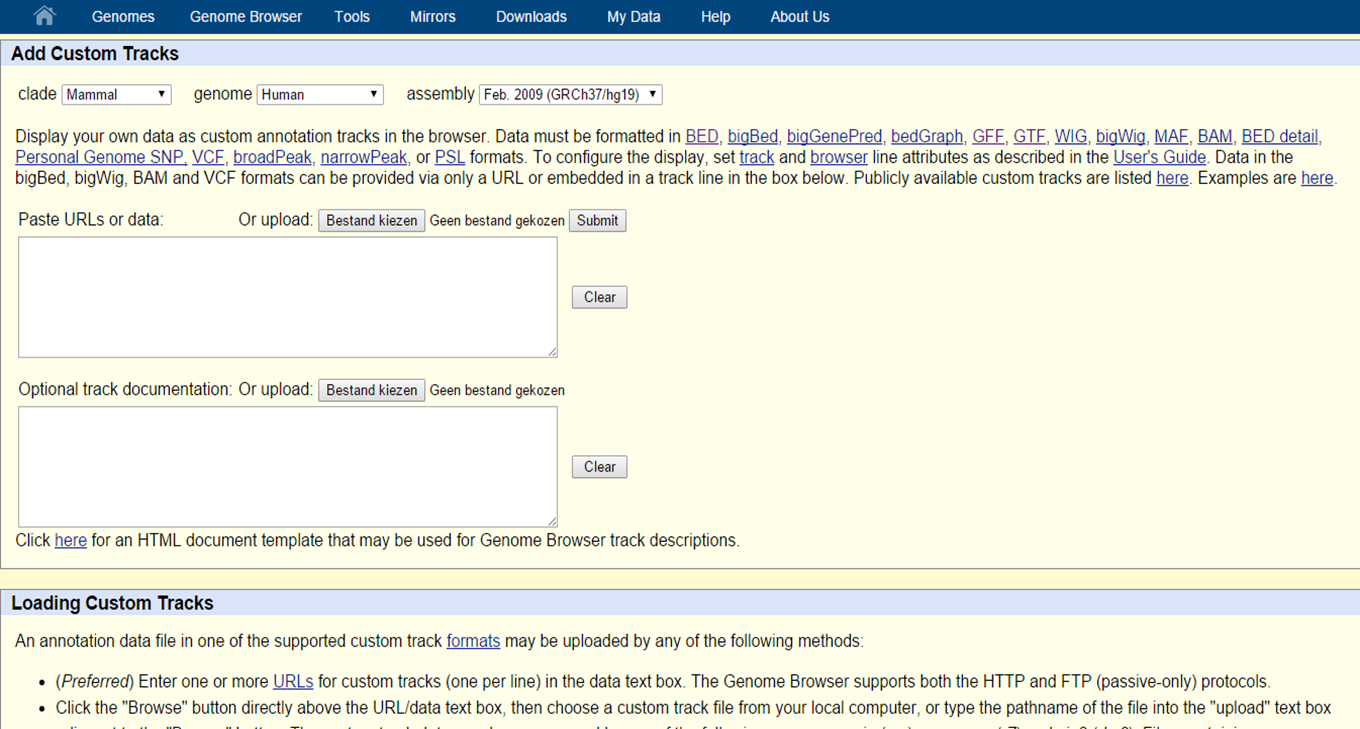
UCSC Custom Tracks
Since the sequence of reference genome can also be found in the UCSC Genome and Table Browser, it is possible to search sequence similarity. To find a query, which will be a sequence of choice, in the human genome, one can use BLAT (Basic Local Alignment Tool). To find your query in multiple genomes (tip: to find homologs for example) one must use BLAST (Basic Local Alignment Search Tool). The UCSC Genome Bioinformatics Group also provides a Blat tool on their website for you to find your query sequence in the genome.
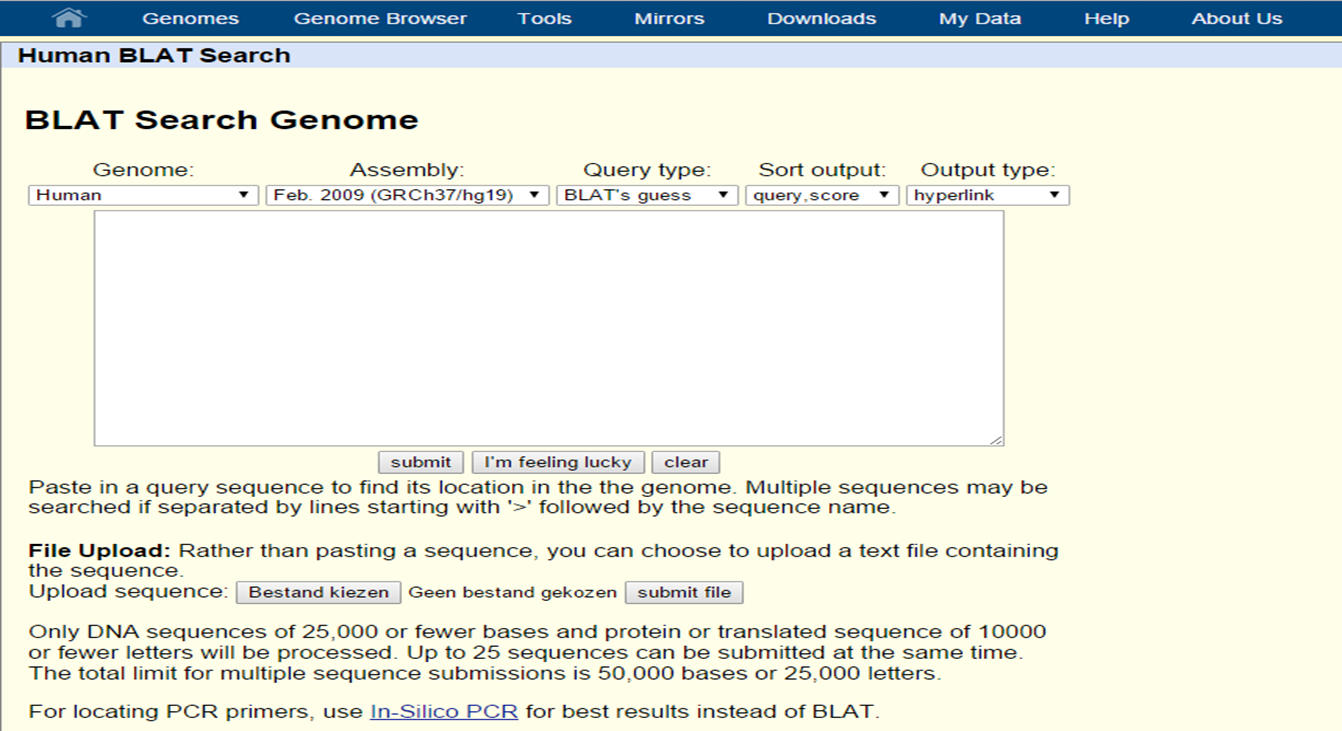
UCSC Blat
More details on BLAT and BLAST can be found in Chapter 6: Alignments.
[Exercise 1.12. UCSC Genome Browser: BLAT][exercise1.12]
For more information on the UCSC Genome Browser, check out the three tutorials; UCSC Genome Browser: An Introduction, UCSC Genome Browser: Custom Tracks and Table Browser, and UCSC Genome Browser: The Additional Tools on http://www.openhelix.com/tutorials.cgi.
Ensembl is a collaborative effort between EMBL-EBI and the Wellcome Trust Sanger Institute to provide central database for studying the human genome and genomes from multiple other species. Ensembl has its own gene annotation pipeline (Ensembl identifier: ENSG....), which is used for sequencing data. With the Ensembl Genome Browser a graphical representation of the annotated genes aligned to a reference genome is provided. Other data types are also available, such as repeats, sequence variants, regulatory features, etc.
Data can be exported in multiple formats (e.g. FASTA sequence format, GFF format, EMBL format, etc.)
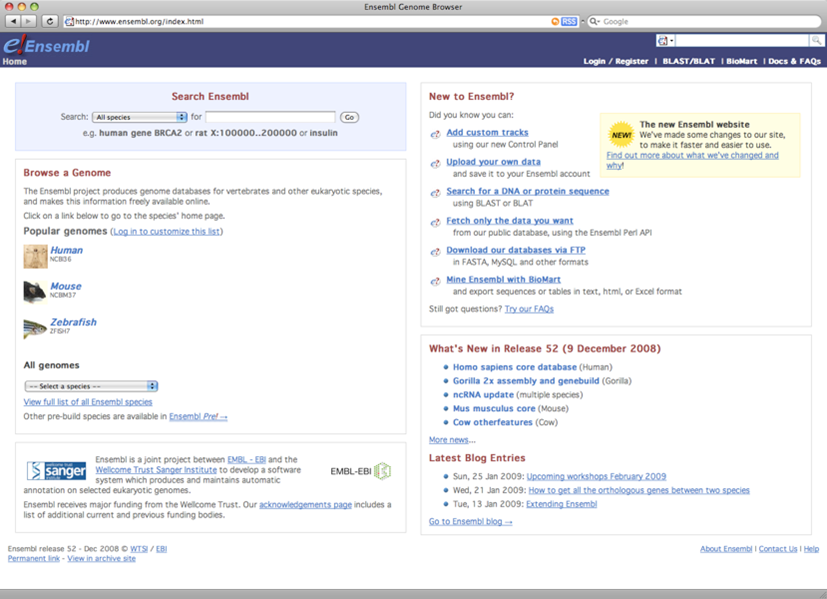
Ensembl homepage
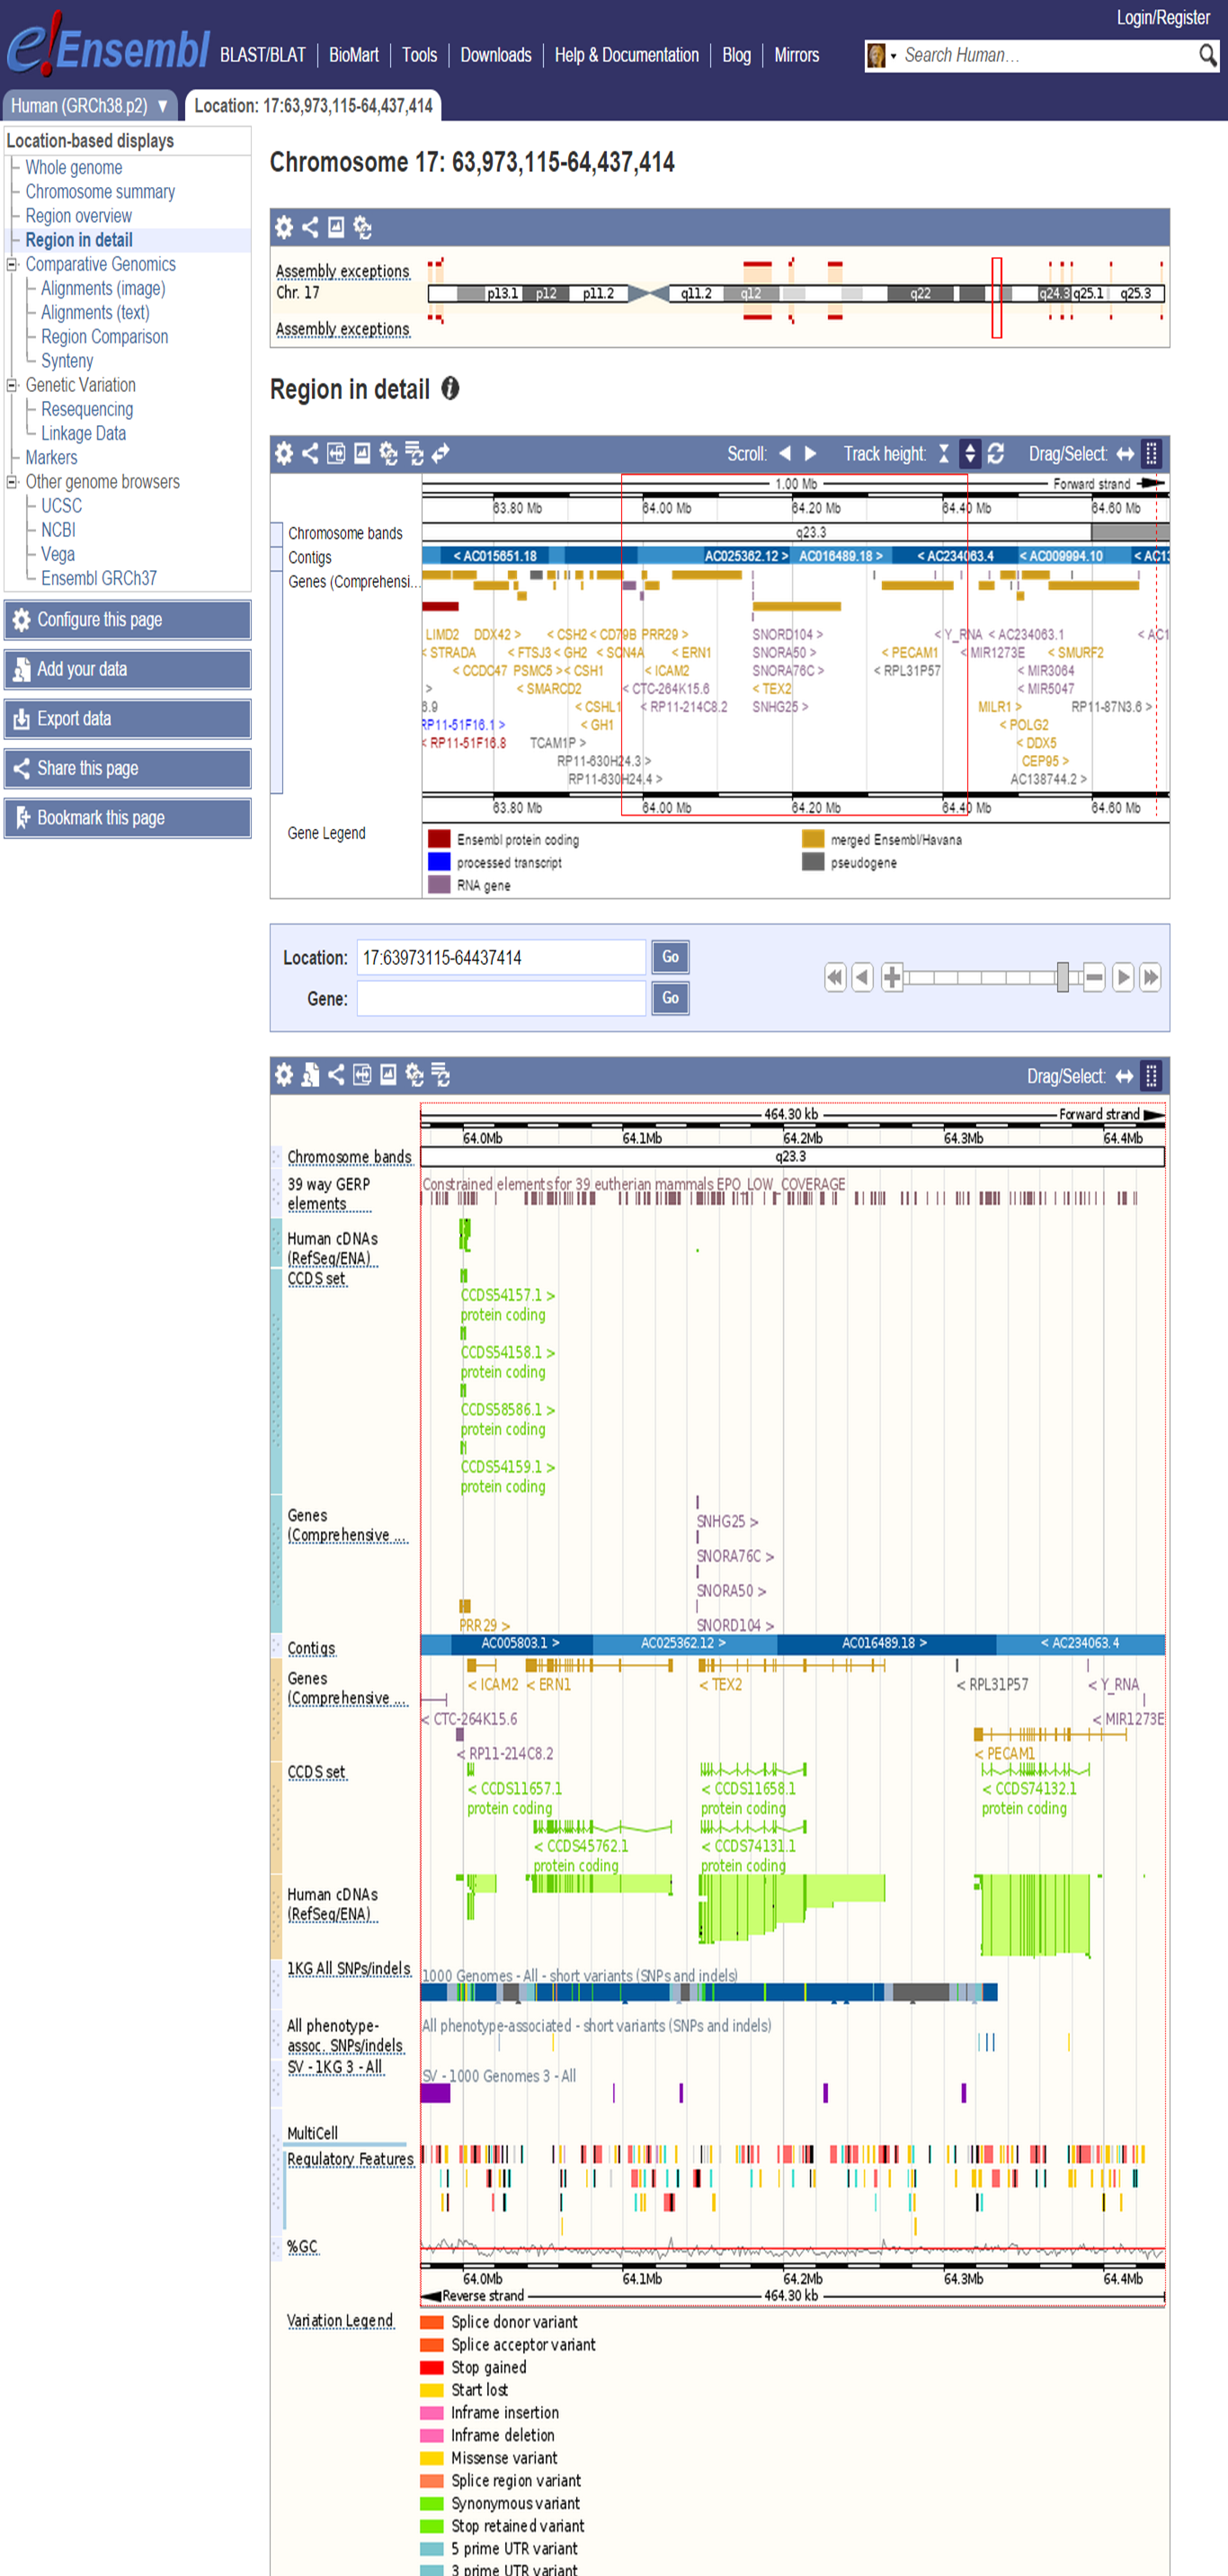
Ensembl Genome Browser interface
Select 'Configure this page' to define data tracks.

Ensembl additional information on a gene
Select 'Export data' to retrieve data from the Ensembl Genome Browser.
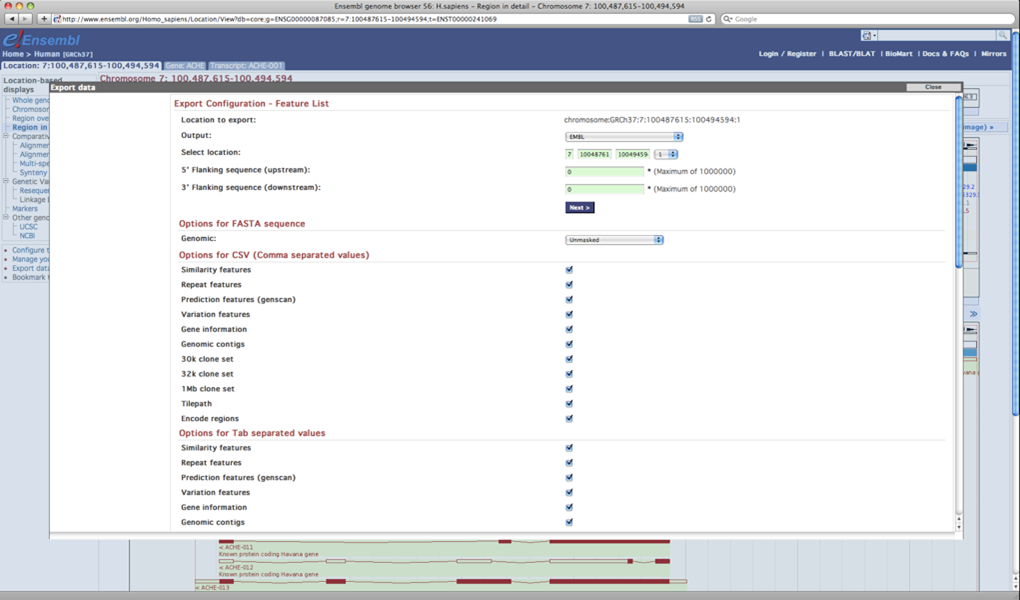
Ensembl export data window
Two main types of databases structures are used in the biological databases: a flat file database or a relational database. These database structures are accessed by a Graphical User Interface (GUI), which is mostly web-based in html code or more advanced programming languages for more dynamics.
Flat file indexing systems represent an ordered collection of similar files, which are formatted in a standard format conform their content. A flat file database can be compared with a filing cabinet, in which each file contains one record. The collection of files can be made useful through the ordering and indexing of the files in the flat file database.
Indexing a flat file database is represented by the creation of an index file where a particular attribute from a file is extracted and this attribute value is paired with the information for the filename and location. Through the creation of an index file speed and performance in finding relevant documents for a search query is optimized. Without an index, a search query would launch a scan of every document for this query. This would require a lot of time and computing power to complete this search task.
An example of such a flat file database is GenBank.
In a relational database data is stored into tables, which are called relations, with rows and columns corresponding to individual records and attributes for the records, respectively. Individual records are also called tuples. Each record is represented by a unique identifier, which gives the possibility to link between different tables of data. Relations can occur among the columns of a table and/or among different tables.
Examples of a relational database are the genome browsers Ensembl and UCSC, Gene Ontology, Chado database on FlyBase.
SQL (Structured Query Language) is a database computer language, which allows the retrieval and management of data in a relational database, the creation of a database schema and modification.
The Gene Ontology database, for example, is based on SQL to build the database.
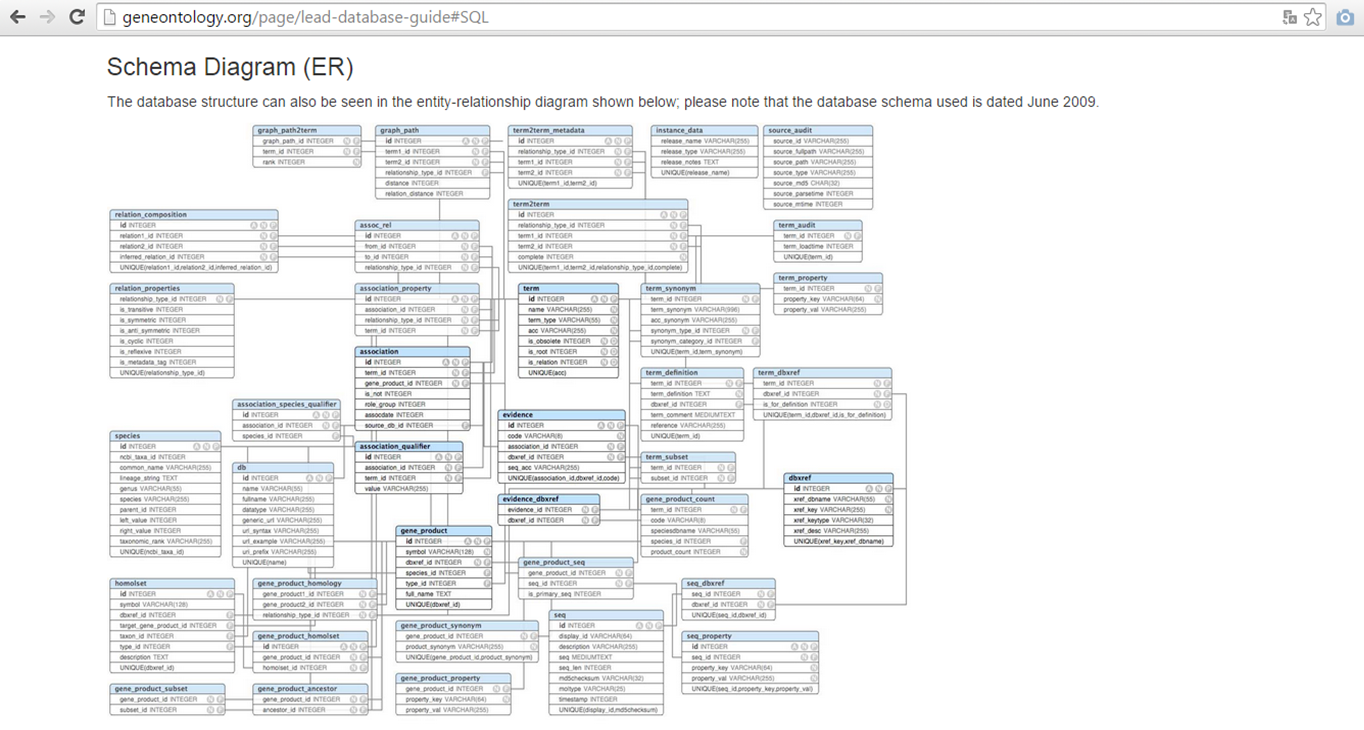
GO database SQL schema
More information about GO as a database can be found in the GO Database guide: http://geneontology.org/page/lead-database-guide
With SQL client software such as HeidiSQL for Windows and Sequel Pro for Mac OS, one can query databases which are hosted on a MySQL server with different statements such as select, from and where.
UCSC
Step 1: Install HeidiSQL (http://www.heidisql.com/ Downloads>Installer)
Step 2: Enter these values and then connect
Hostname=genome-mysql.cse.ucsc.edu
User=genome
Password=
Step 3: Choose a database (e.g. hg18)
Step 4: Select custom query and enter a SQL query and launch via the blue arrow
select * from refGene where chrom='chr1' and txStart>10000000 and txStart<2000000
MySQL database query search
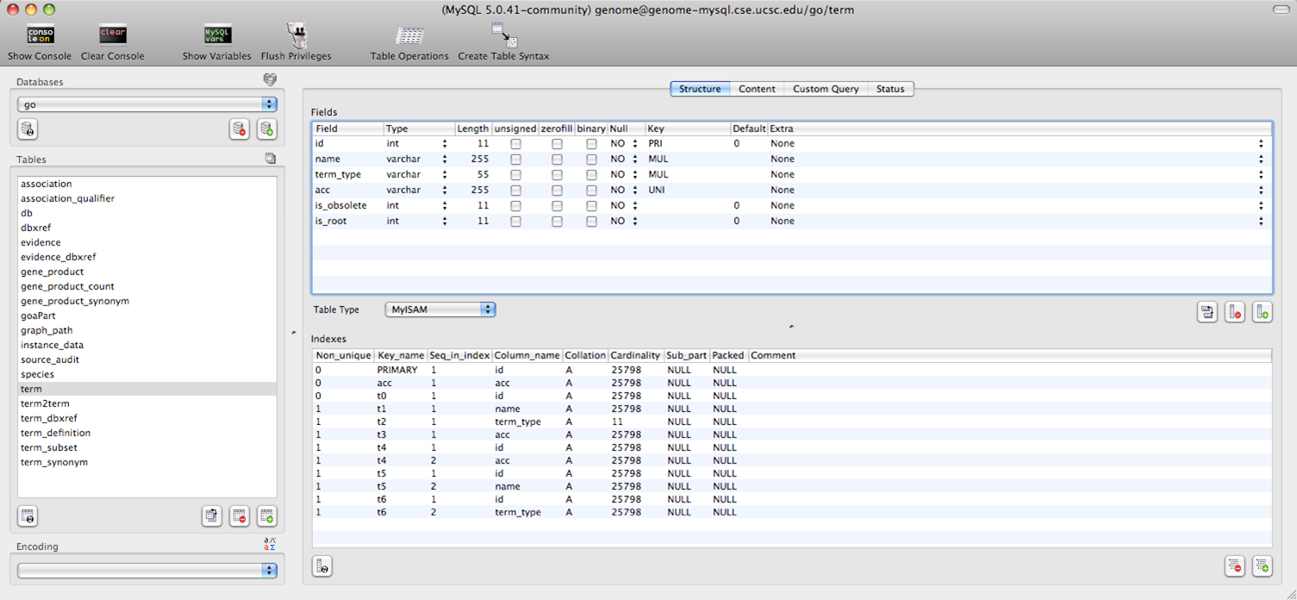
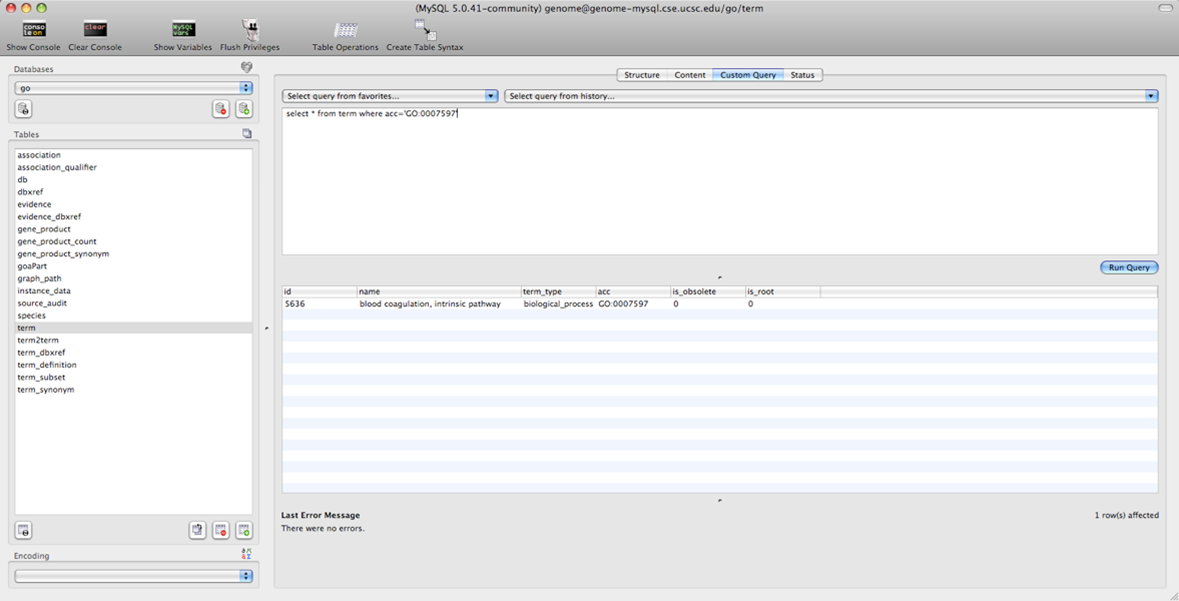
Step 5: The Gene Ontology (GO) database can also be querried from the UCSC MySQL database.
select * from term where acc='GO:0007597'
MySQL database query search
MySQL database query search
MySQL database query search
MySQL database query search
Gene Ontology
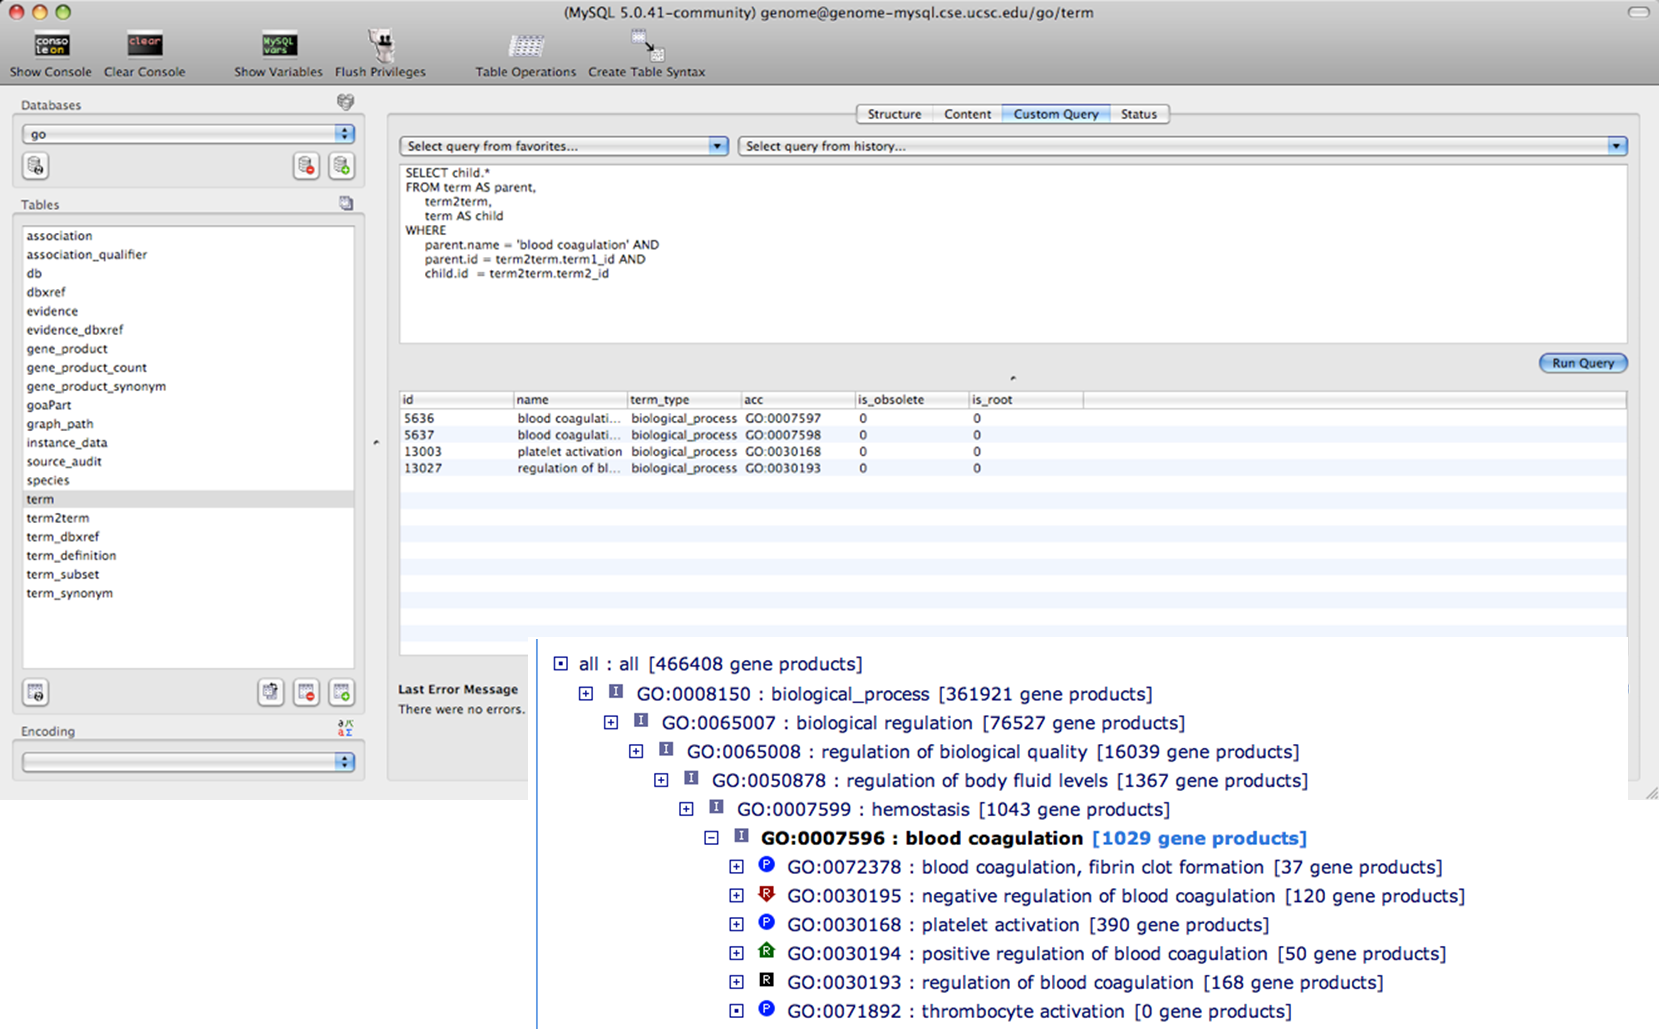
We can also query directly in the Gene Ontology database by accessing it directly.

MySQL database query search GO
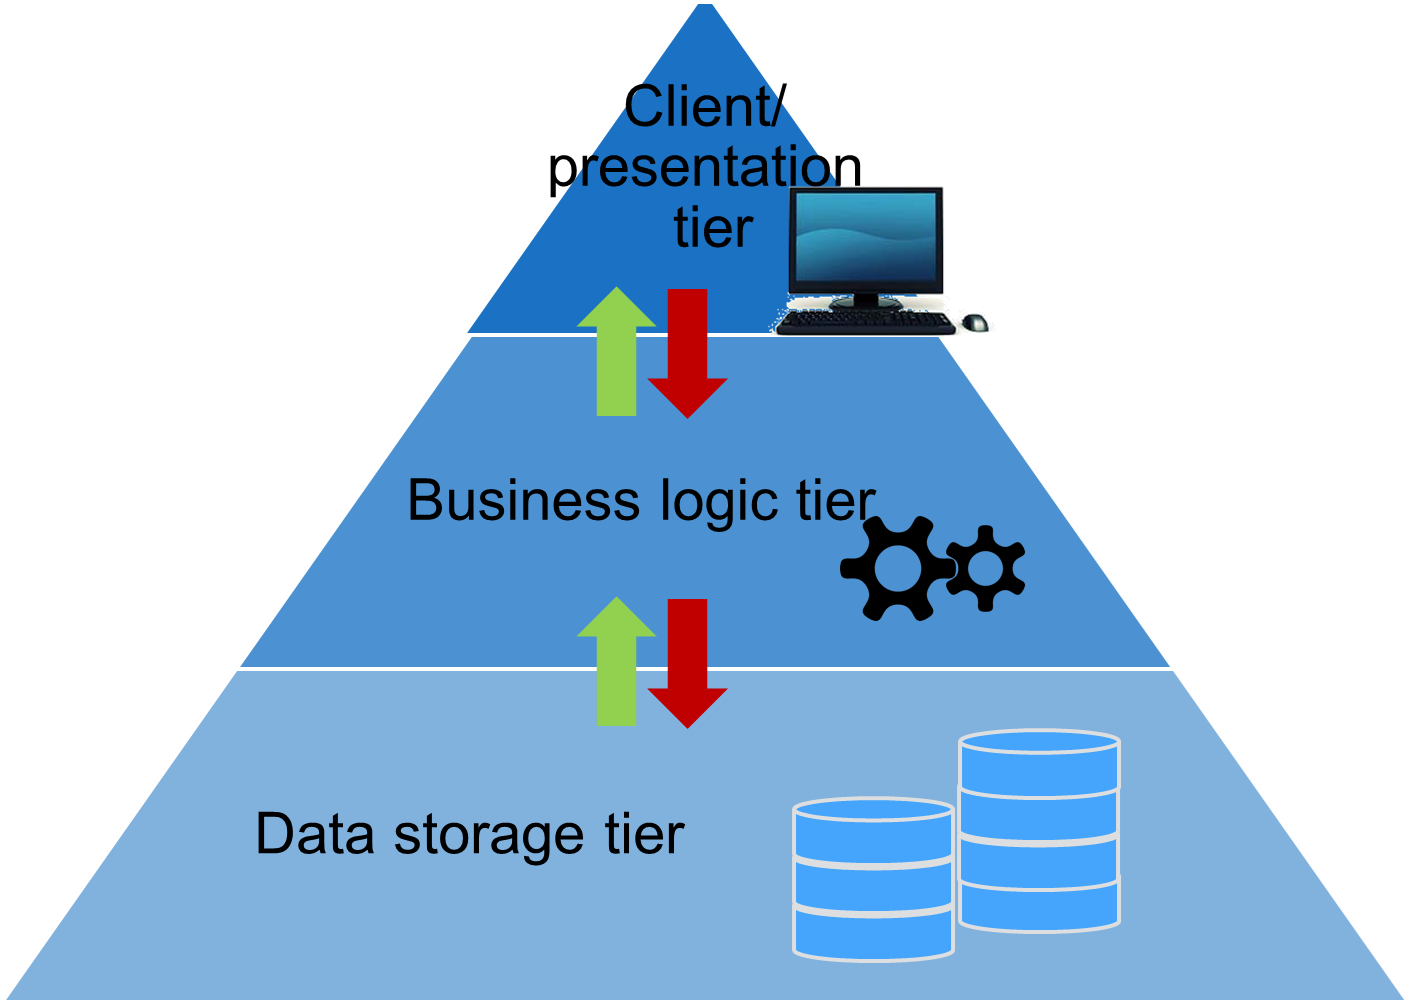
To summarize the organisation of database structures, a 3-tier architecture is defined. This is a client-server architecture which includes three tiers: a presentation, business logic and data tier. The presentation tier is characterized by the user interface in which tasks are interpreted and results are shown. The logic tier is placed in between the presentation and the data tier and interacts with both tiers. Here, the commands, calculations and tasks are processed. The data tier serves as data storage or retrieved from databases. Data from the data tier is transferred to the logic tier, which processes the data and passes the processed data to the client, which is located in the presentation tier.
Schematic representation of the 3-tier architecture