
Alignment two sequences
As was mentioned in Chapter 4 on gene prediction, the extrinsic methods are based on sequence similarity/homology. Therefore, an alignment has to be performed of the query sequence to another sequence. Alignment is the task of locating two or more DNA, RNA or protein sequences in such a way to identify and maximize their similarity. DNA, RNA and protein sequences are found to change during evolution. A considerable divergence can exist between sequences nowadays derived from the same ancestral gene. These changes in sequence composition or length may mask any of the underlying similarity between the sequences. Therefore, alignment algorithms are developed and are applied to sequences to reveal and maximize their similarity.
Now, let's start of with two sequences: CAGTCCTATT and CAGTGGTATT. When we align these two sequences, by visual inspection it is quite clear that two nucleotides from each sequence do not align, namely CC and GG. The alignment gives us 8 nucleotides that match. This represents the maximum sequence similarity.
Alignment two sequences
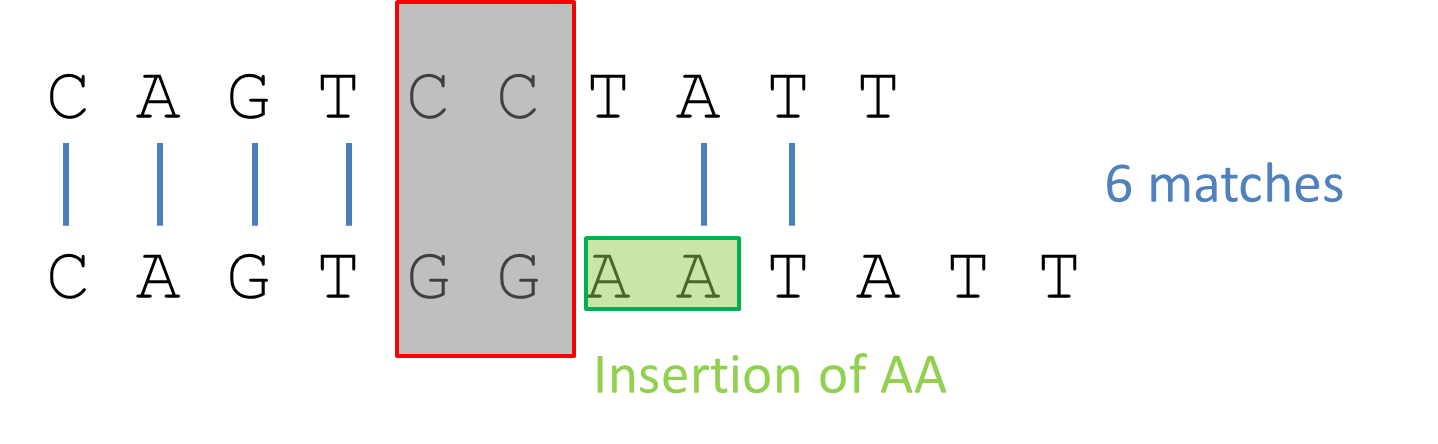
An insertion of for example two nucleotides in one of the two sequences, will increase the length of one sequence. This gives us a distorted alignment of the two sequences with only 6 nucleotides that match.
Alignment two sequences
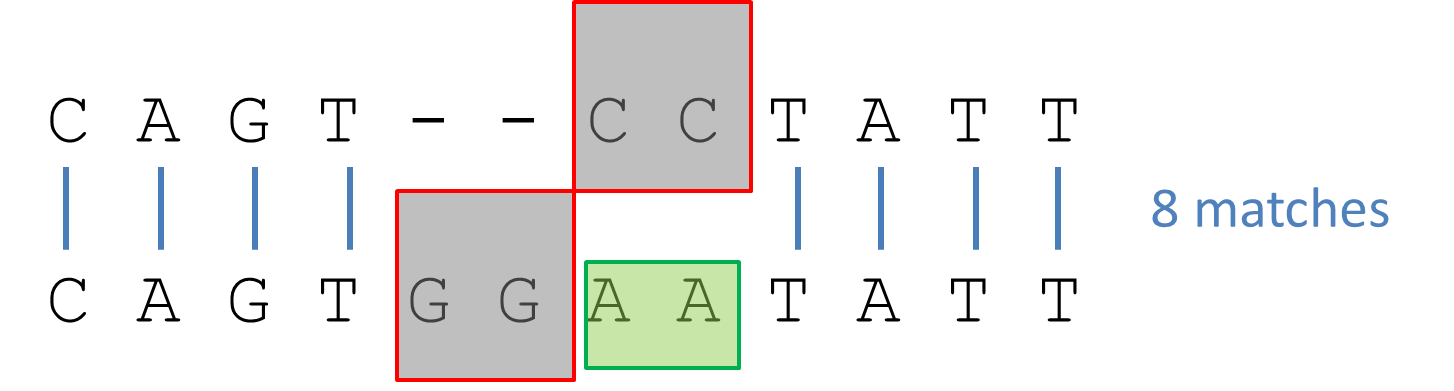
Quickly we can see that the alignment is not ideal. The last four nucleotides TATT can be aligned in both sequences, but are not due to the insertion of AA. Introducing gaps (- -) allows us to restore the maximum sequence similarity to 8 nucleotides that match.
Alignment two sequences
In this simple example, alignment is straightforward. However, with longer and more diverse sequences multiple alignments are possible.
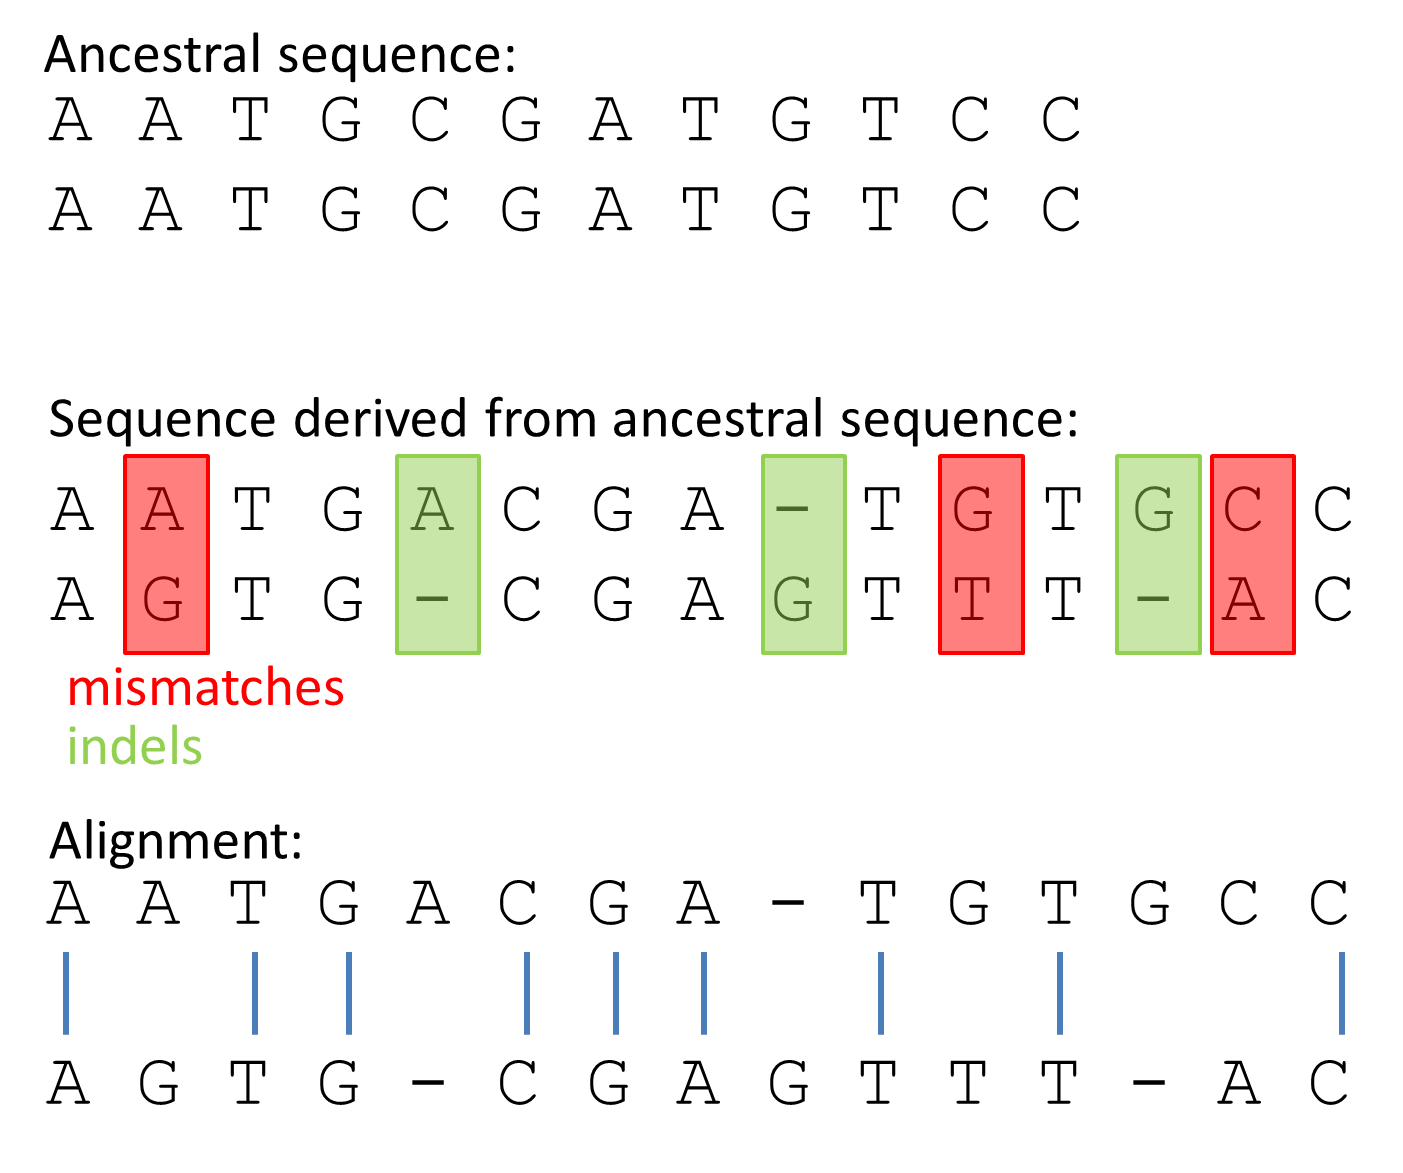
During evolution, sequences derived from an ancestral sequence can diverge through random mutations, such as insertions and deletions (indels), and subsitutions (mismatches).
Alignment two sequences
Alignments Similarity between two sequences is a quantitative measure of how related two sequences are to one another. This is based on an observable measure, e.g. when two sequences are aligned, counting how many residues (nucleotides, amino acids) are similar provides the most commonly used measure of similarity: percent identity. This measure is used to quantify the changes when two sequences undergo evolutionary divergence. Looking at the sequence similarity is used to identify residues, which are crucial for gene/protein structure or function. A high degree of sequence similarity may point to a common evolutionary ancestry or a common biological function.
Alignment of two sequences can reveal homology. Homology is a conclusion, which results from the optimal alignment between the two sequences and the assessment of their similarity. Homology implies an evolutionary relationship. This is no quantative measure, either sequences/genes/proteins are homologous or not. In detecting homology, it is easier to detect when comparing protein sequences than nucleid acid sequences (why? multiple triplets of nucleic acids encode one amino acid).
Homologous sequences/genes/proteins seperated by a speciation event (one species is diverged into two species) are called orthologous.
Homologous sequences/genes/proteins are called paralogous when they originate from a duplication event in the genome.
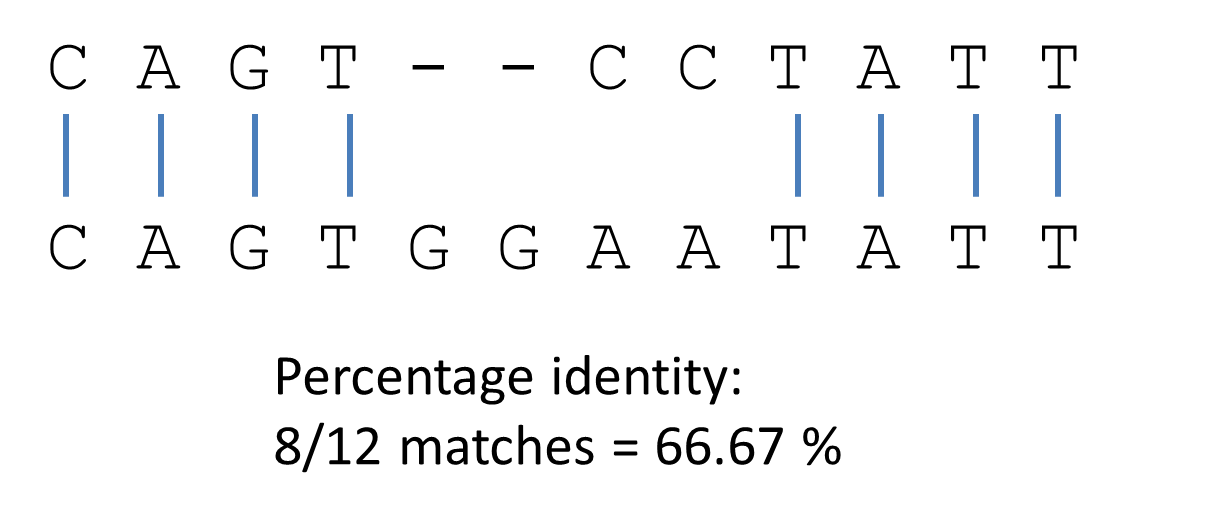
To quantify the similarity of two sequences, one must determine the percentage identity by calculating the amount of residues that is identical when two sequences are aligned. The alignment of two completely unrelated sequences will not yield in 0 % identity, since there are only 4 nucleotides and 20 amino acids and some similarity will always be detected in the alignment.
Alignment two sequences
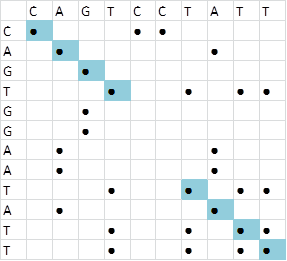
Besides the calculation of the sequence similarity, one can also perform visual assessment of the similarity with the use of dotplots. A matrix with the two sequences to compare is set. Dots are placed when there is a match. Regions of similarity can simply be identified by looking for dots connected by a diagonal.
Alignment two sequences
Dotplots can also be made with the EMBOSS tools dotmatcher on the web-interface or via the commandline.
To identify repeats in a sequence, one can make a dotplot of the sequence with itself. Let's compare the protein sequence of MK01_HUMAN (Mitogen-activated protein kinase 1) with itself.

Alignment two sequences MK01
What we see is only one diagonal from the beginning of the sequence until the end. This is interpreted as a sequence that does not contain any amino acid repeats, otherwise we would find multiple possible alignments (more than 1 diagonal).
BRCA2 contains a sequence of 35 amino acids, which is repeated 8 times, in the protein sequence. Peforming a dotplot on a subsequence of BRCA2 (AA residue 1000 - 1250) and itself will allow us to visualize the repeat sequence. This sequence is repeated twice in this subsequence:
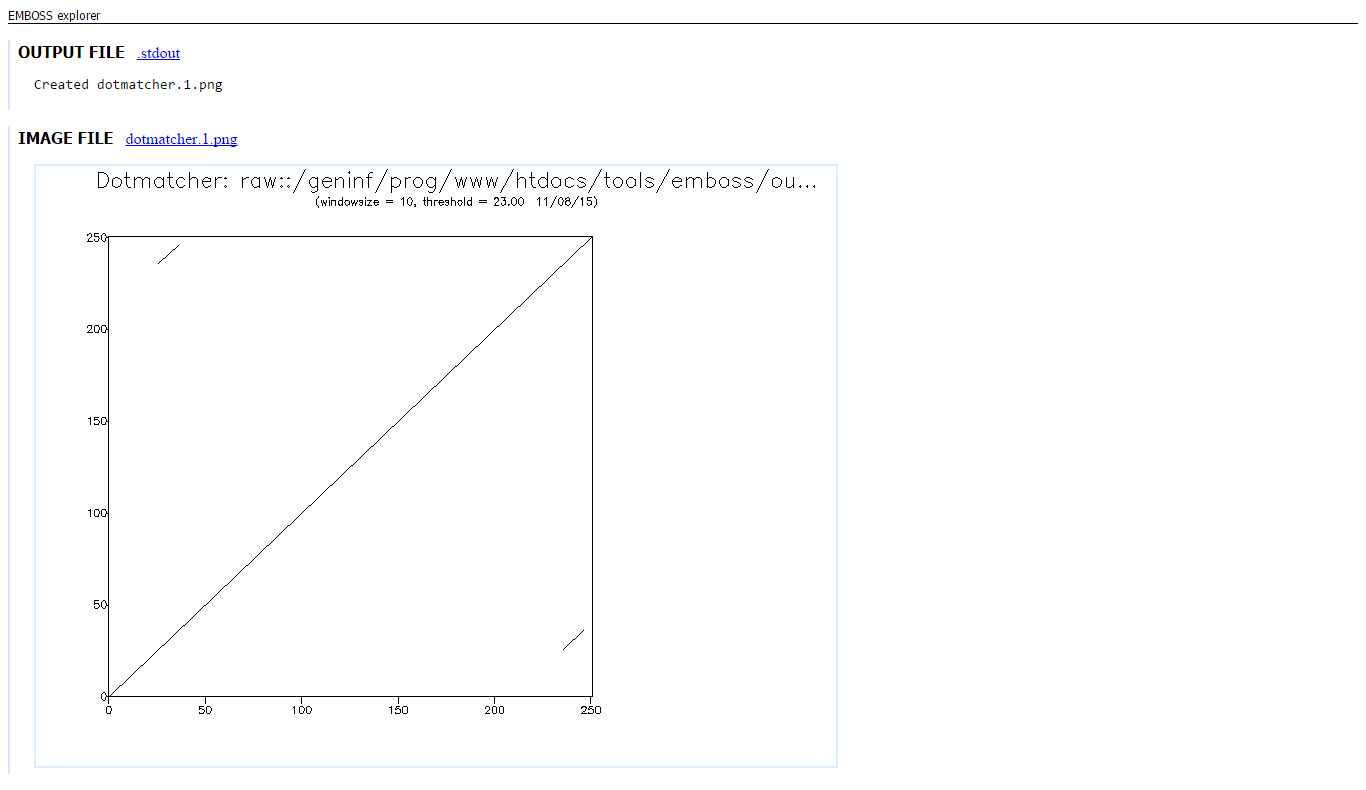 Here we see the diagonal line from start to end of the sequence, which represents the alignment of the sequence with itself. Besides this large diagonal line, we can see two additional small diagonal lines, which are actually identical, because they are eachothers reflection. The small diagonal line, represents the alignment of the 35 residues with the exact same residues, which are repeated once in this subsequence of BRCA2.
Besides some sequence being repeated once in the protein, it can also be repeated several times. For example, the full BRCA2 sequence contains 8 repeats of the same 35 AA residues. The protein Ankyrin repeat domain-containing protein 1 (ANKR1_HUMAN) also displays multiple repeats.

Alignment two sequences ANKR1
Some other proteins, which contain multiple repeats are: Androgen receptor (ANDR_HUMAN), Ankyrin repeat domain-containing protein 1 (ANKR1_HUMAN) and Major prion protein (PRIO_HUMAN). Try to align one of the proteins with itself with dotmatcher and interpret the plot.
In order to help score the alignments, a scoring matrix is used. This represents an empirical weighting scheme (with values) based on the logarithm of the odds ratio for all possible substitutions, which is designed by taking conservation, frequency and evolution into account. One takes into account which amino acid residues are capable of the substitution for other residues and not exerting an adverse effect in the function of the protein. Amino acids can be similar in charge, size and hydrophobicity. For example, isoleucine and alanine are similar amino acids, due to their hydrophobicity. Also the frequency of particular amino acid residues in all the proteins is taken into account. The rare amino acids are given more weight in the matrix, than the ones that are more common. A scoring matrix also represents patterns observed during evolution. It takes into account how often a residue is observed to replace another residue in nature. Posititve scores represent frequently observed amino acid substitutions and negative scores represent infrequently observed substitutions.
An example of such a scoring matrix is the BLOSUM62 ( BLOcks SUbstitution Matrix) substitution matrix for amino acid redidues. This matrix is designed to score amino acid substitutions by aligning blocks of amino acids with no more than 62% sequence similarity and determining the probability for each substitution.
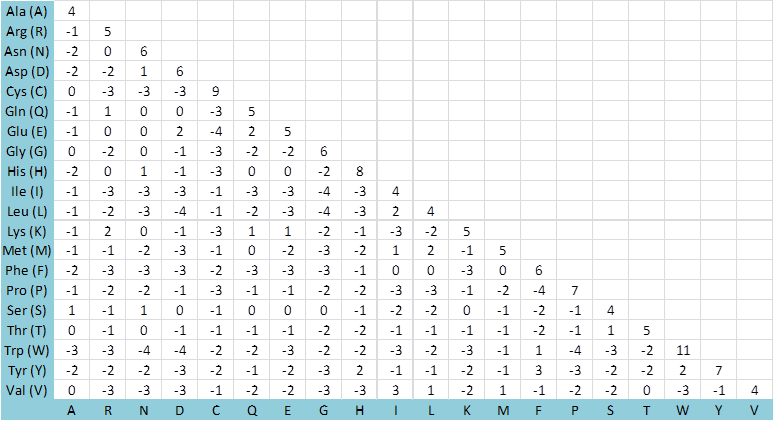
BLOSUM62 Substitution Matrix
To use this matrix, find the value for the corresponding amino acid substitutions and sum all together.
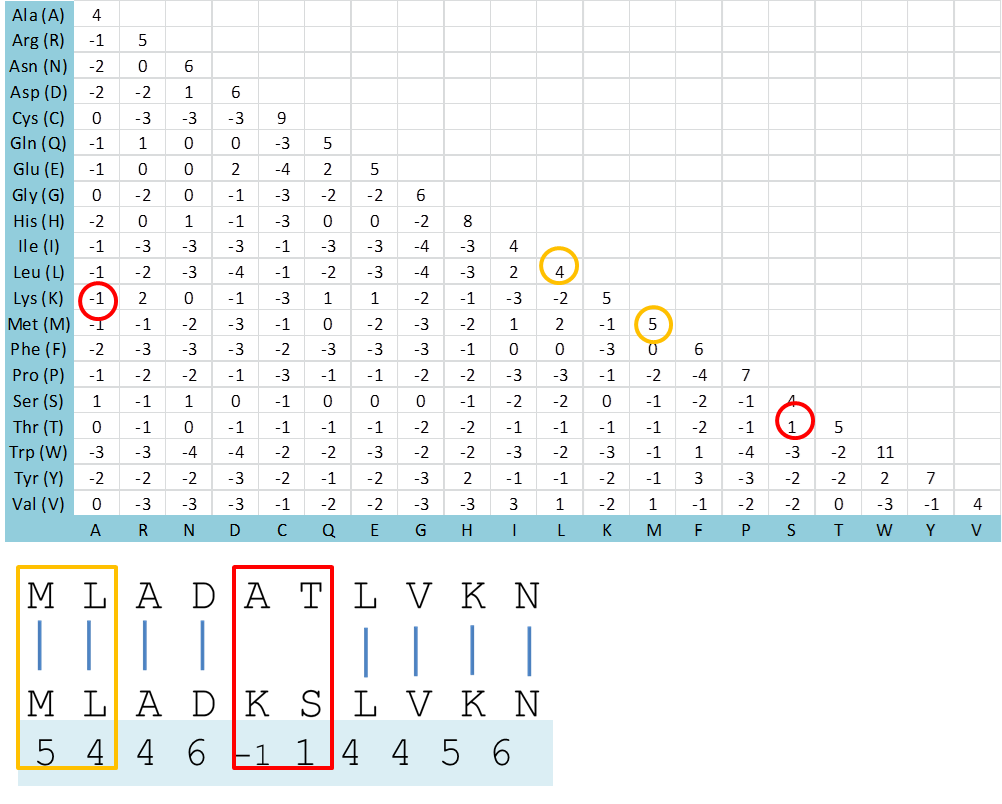
Use of BLOSUM62 Substitution Matrix
Each amino acid is given a certain value derived from the BLOSUM62 substitution matrix. The overall score S = 5 + 4 + 4 + 6 -1 + 1 + 4 + 4 + 5 + 6 = 38

Alignment two sequences
For nucleotides, one can also define a nucleotide scoring matrix, which is usually defined by only matches or mismatches. If we assume that each of the possible 4 nucleotides occur with equal frequency (25 %), we can set up the following nucleotide scoring matrix:
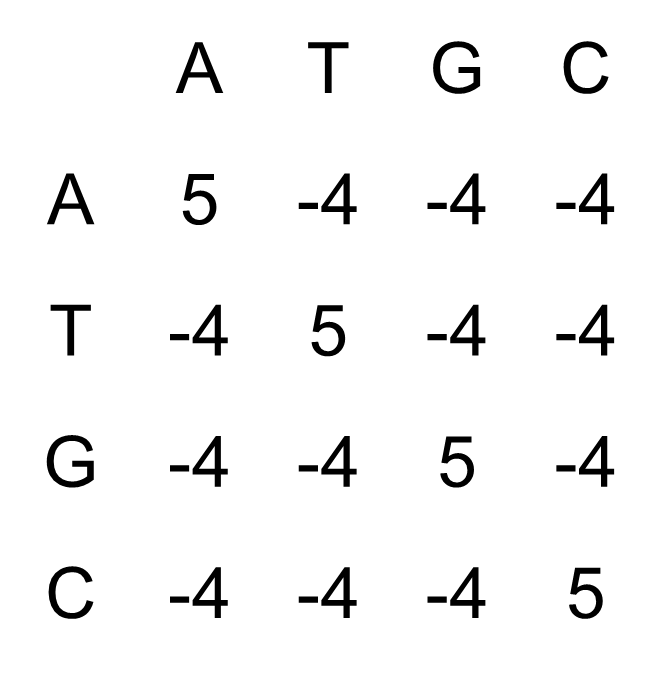
Alignment two sequences
As was mentioned before, gaps (- -) are introduced into alignments to compensate for indels between sequences. In theory, gaps can be introduced many times. However, one should keep the insertion of gaps reasonable. As a rule of thumb, one should not insert more than one gap per 20 residues.
Gap penalties are also defined as a scoring system in the alignment of sequences. Two major types of gap penalties are used: affine and non-affine or linear gap penalty.
Affine gap penalty
A fixed score is used for making the gap. Additional score is used proportional to the length of the gap.
G + (L x n)
G: Gap opening penalty L: Gap extension penalty n: Length of gap
G>L such tat lengthening gaps is more favorable over creating new gaps
Non-affine or linear gap penalty
There is no cost involved for opening the gap. A fixed mismatch penalty is assessed for each position in the gap.
Let's perform an alignment of two sequences and calculate the overal score of this alignment with affine and non-affine gap penalties.
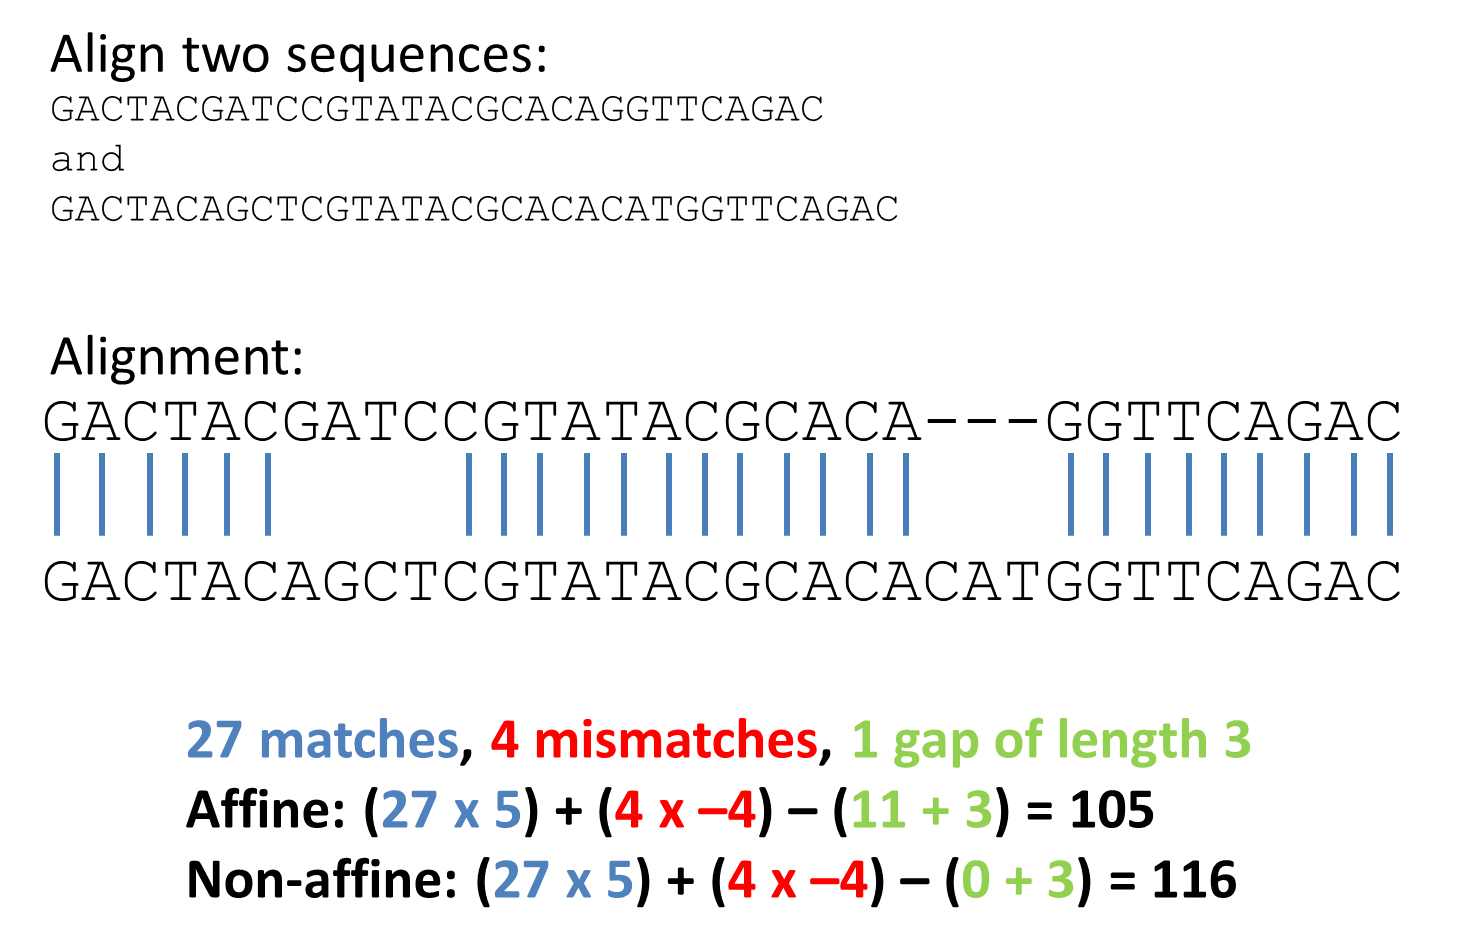
Alignment two sequences
Alignment two sequences
With the use of alignment algorithms, one can use dynamic programming to find the alignment with the highest score, instead of generating all possible alignments for two sequences and chosing the one(s) with the highest score.
Sequence alignment algorithms can fall into two general categories: global (Needleman-Wunsch) and local (Smith-Waterman) alignment.
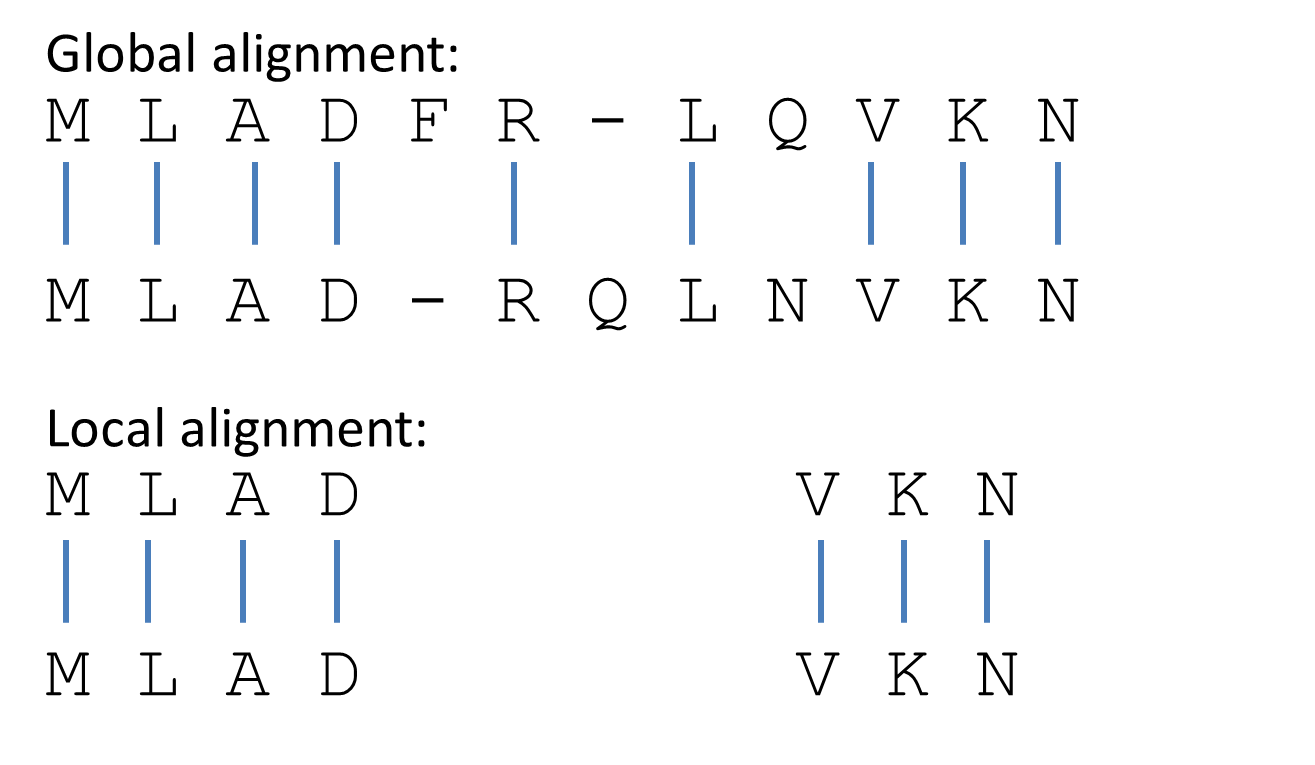
Global alignment:
Compare two sequences along the entire length and find the best alignment across the full length of the sequence. This is in general in case of highly similar sequences or sequences of approximately the same length.
Local alignment:
Find the most similar regions in the two aligned sequences instead of finding the best alignment across the entire length from both sequences. This allows us to identify subsequences within the two sequences, which are compared. These subsequences may have a biological relationship. Performing local alignment often gives more than one result, since there might be more than one domain or subsequence common to the two sequences. Local alignment is best for sequences that share some degree of similarity or for sequences of different lengths.
Alignment two sequences
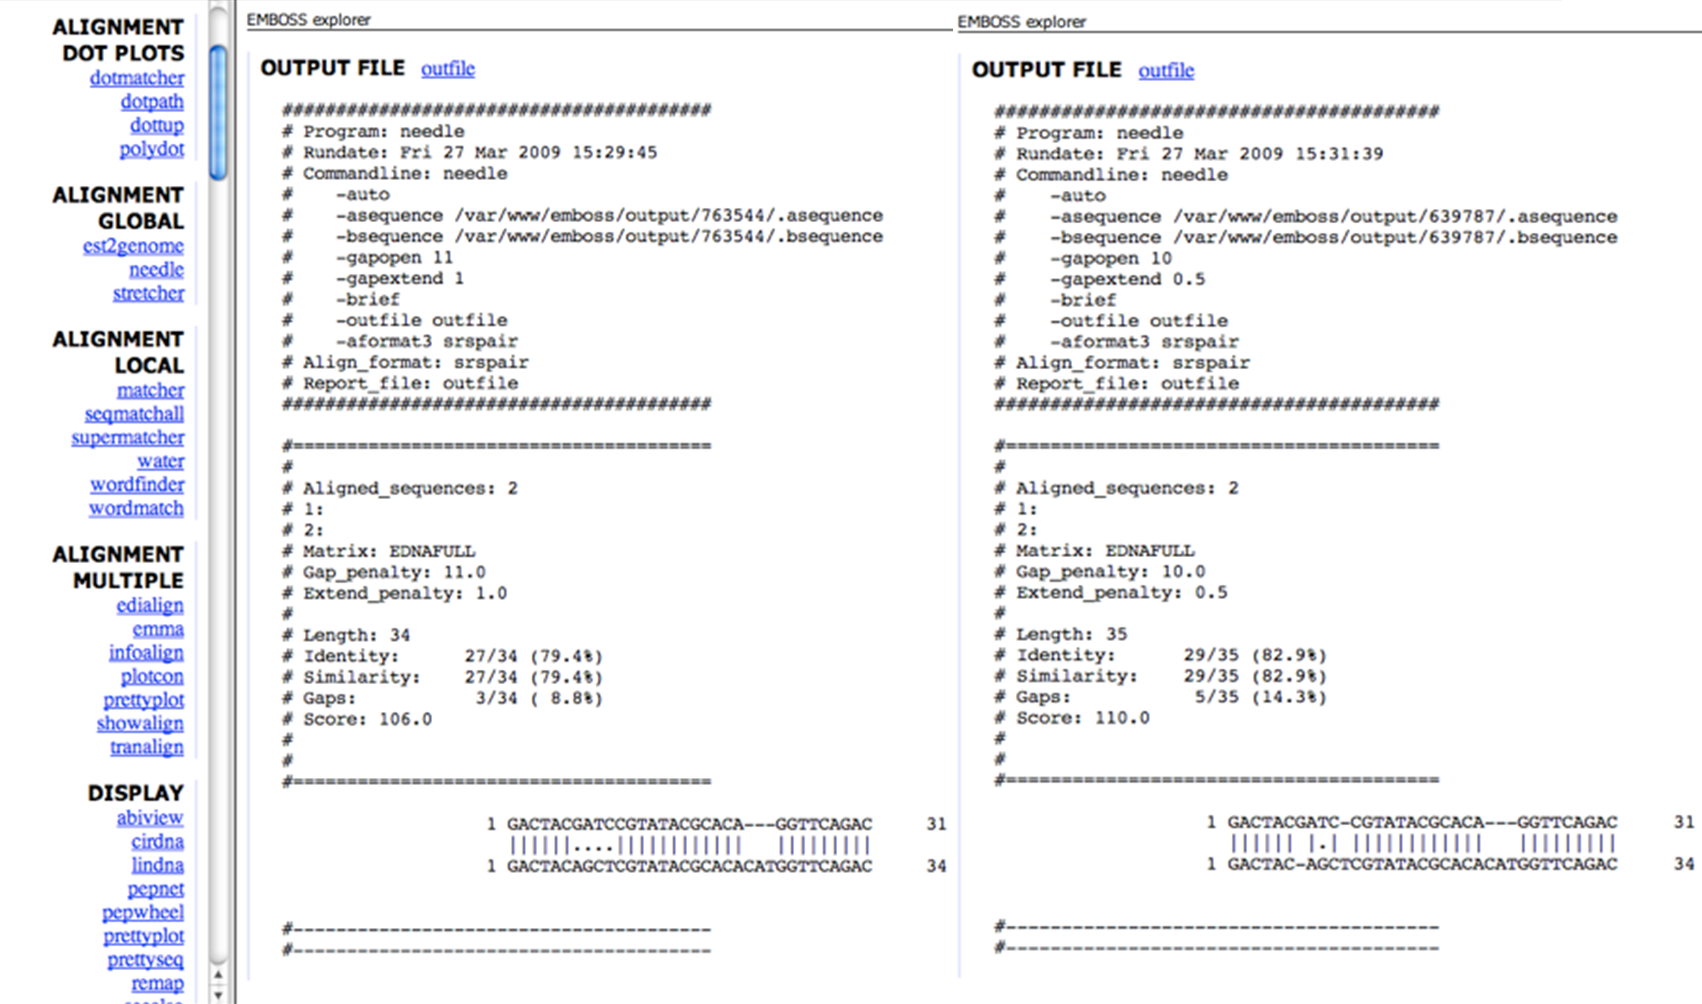
With the EMBOSS tool needle or waterone can align two sequences global and local, respectively, through the command-line or the web-interface.
The Basic Local Alignment Search Tool or BLAST, hosted by NCBI, detects similarity between sequences of interest http://blast.ncbi.nlm.nih.gov/Blast.cgi.

BLAST homepage
Multiple alignments are possible:
The alignments are performed through the BLAST algorithm.
As the name indiciates, BLAST is a local alignment method to identify the best alignment of your query sequence search against target sequence(s). It also lists you other possible alignments, which are less ideal.
The BLAST alignment works as follows:
Considering a sequence of nucleotides or amino acids, the sequence is split into 'words'of three characters. This three-letter word is searched for in the selected database. Not only an exact match is searched, but also three-letter words that are related to the original three-letter word are taken into account. This, because, amino acids can be substituted while maintaining the function of the sequence due to the similarity of some amino acids. For scoring these substitutions by default the BLOSUM62 matrix is used to calculate the total score per three-letter word. Three-letter words are ranked from high to low BLOSUM62 score. BLAST automatically sets a threshold for this score, but the user can also define a certain threshold.
Once this three-letter word is aligned, the algorithm tries to extend the alignment at both sides of the word. In this further alignment BLAST considers the matches, substitutions, mismatches and gaps to obtain a cumulative score. Once this score exceeds a certain threshold, the alignment is reported into the BLAST output. This is then called a high-scoring segment pair. On the other hand, if mismatches and gaps take the upper hand in the alignment, the score drops and if below a certain threshold the extension of the alignment is stopped. Now, the alignment that is reported is the one as was reached by the highest score.
To conclude, an expectation value E is calculated based on the number of high-scoring segment pairs and their length. By this measurements false positives can be excluded. Lower E-values mean greater biological significance of the alignment result. For example, an E-value of 0.05 means this observed alignment has a chance of 5 in 100 to occur by chance.
For more information: Bioinformatics: A practical guide to the analysis of genes and proteins. Baxevanis AD, Ouellette BFF. p304-306.
On the BLAST homepage, select blastp to align a protein sequence against a protein database. For example, use the sequence of the Drosophila melanogaster prospero protein, isoform I (RefSeq). Paste the FASTA sequence and select the database to search against.
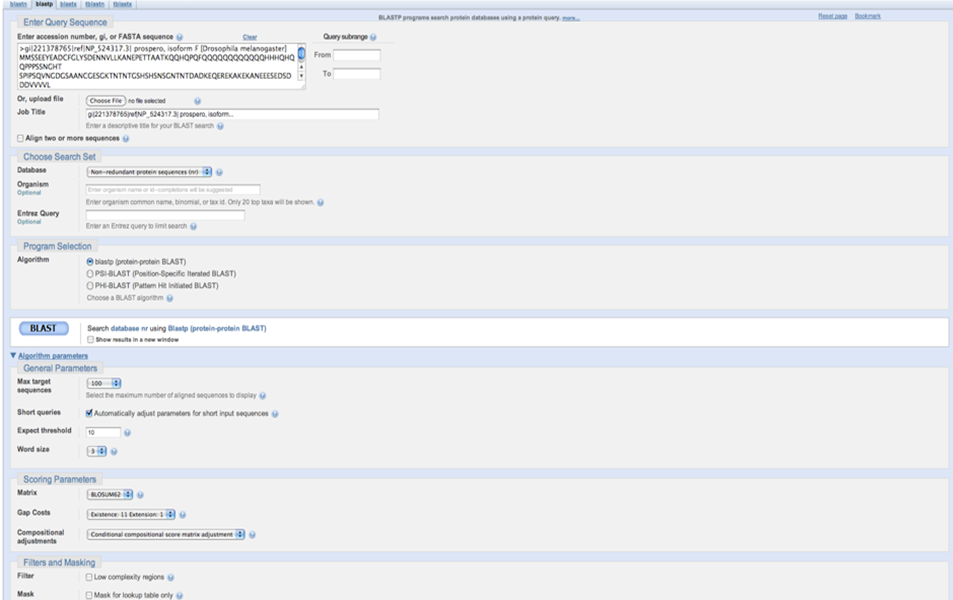
BLAST search
Job is running:
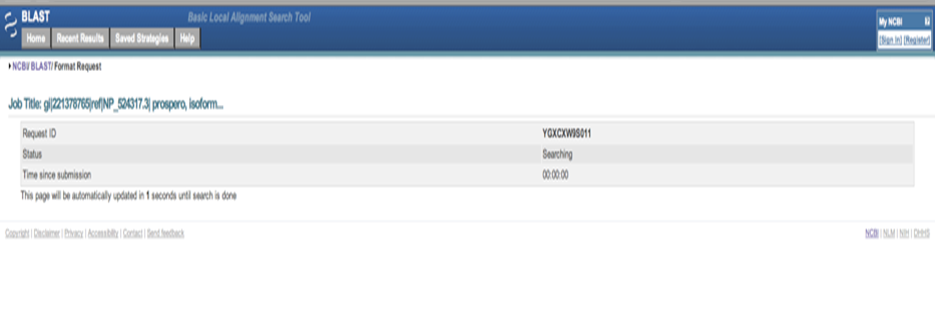
BLAST search
The BLAST output shows a graphical representation of the results. Database matches are colored to represent the degree of similarity with your query sequence.

BLAST search
A list of possible hits is provided with the expected value E, which is calculated through the BLAST algorithm. The most significant alignments are at the top and have the lowest E-value :
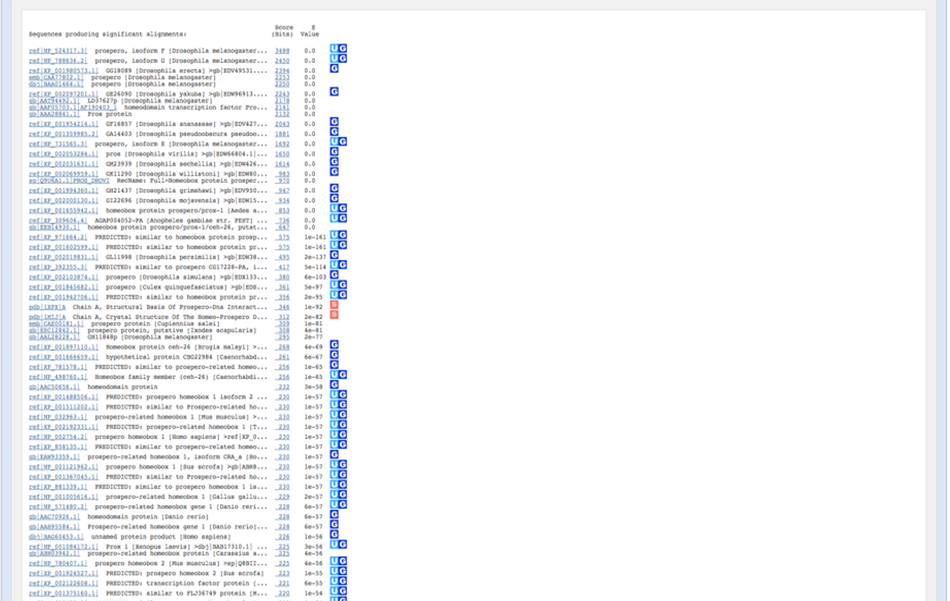
BLAST search
Many hits have very low E-values. Therefore, searching on a subset of a database (species-specific) might help.
Alignments of possible hits can be viewed:

BLAST search
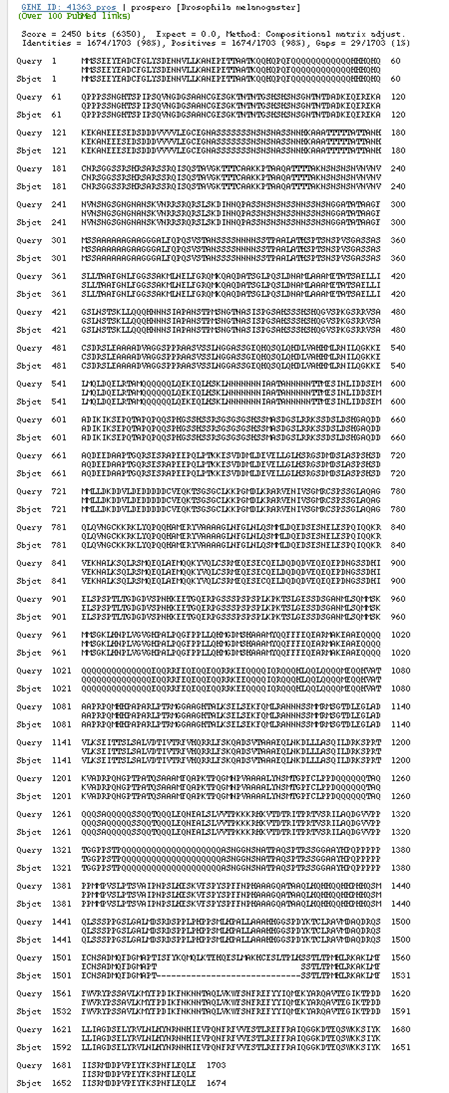
BLAST search
It is also possible to BLAST against the Uniprot database http://www.uniprot.org/blast/.
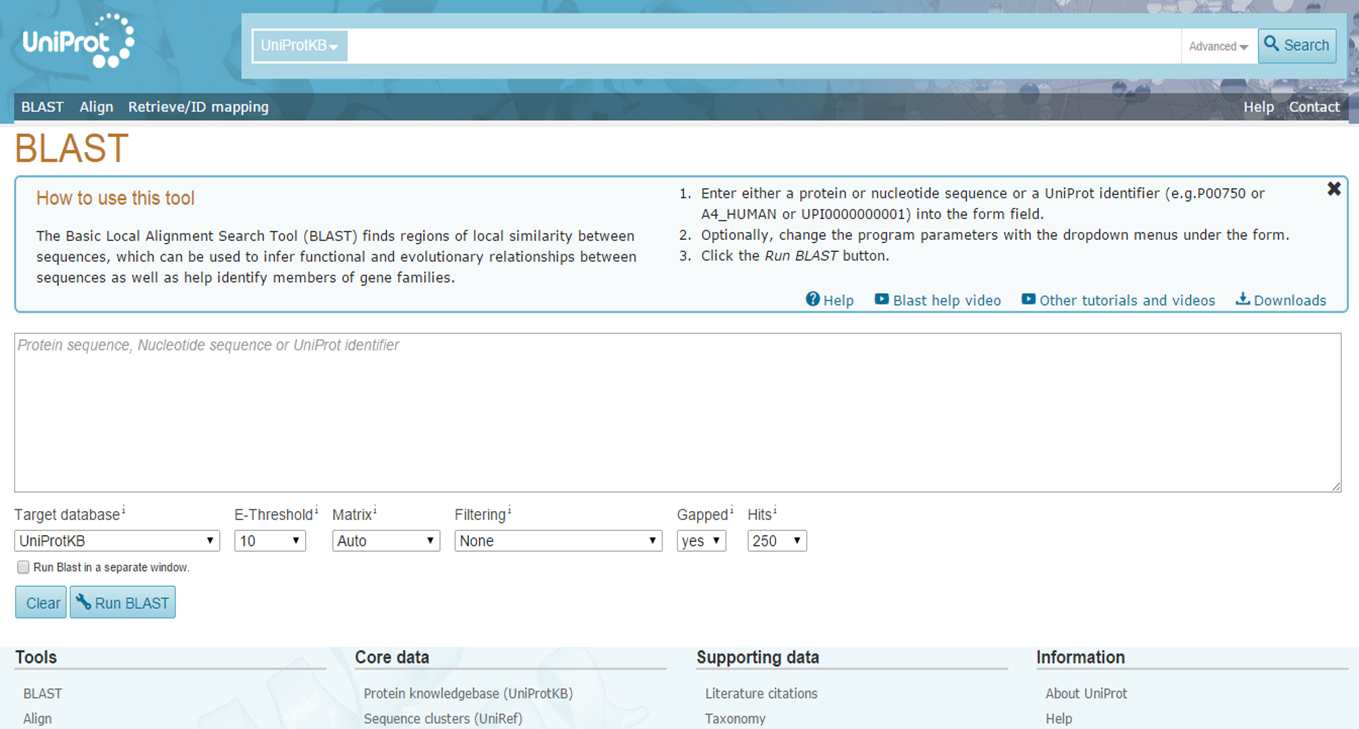
BLAST Uniprot database
Several other programs/tools exist for performing alignment of two sequences.
MEGABLAST: within nucleotide blast
Looks for exact matches of longer nucleotide sequences and is faster than blastn.
PSI-BLAST: within protein blast
Identify distantly related proteins that have not been found using the traditional blastp.
FASTA: comparable with BLAST
BLAT: BLAST-Like Alignment Tool
Allows alignment of longer nucleotide sequences having more than 95 % similarity. BLAT uses an indexed version of a database in order to scan quickly. BLAT is often used for searching a query sequence against a genome or to compare between species.
Let's compare the sequences from human PAX6 and drosophila ey (eyeless) proteins by aligning these two sequences to eachother.
Retrieve the protein sequence or UniProt identifier for human PAX6 and drosophila ey from the UniProtKB database.
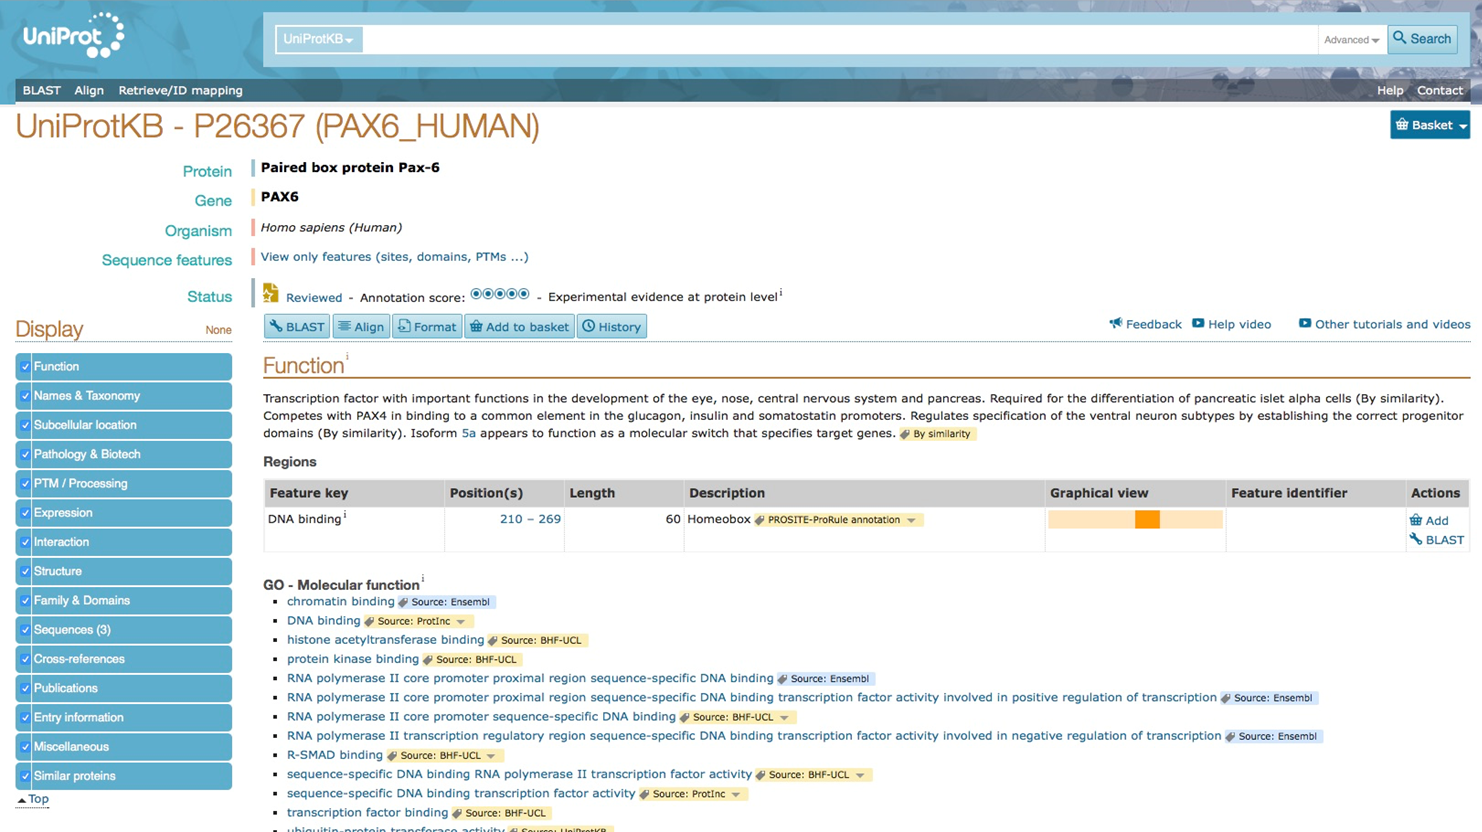
Human PAX6 protein in Uniprot database
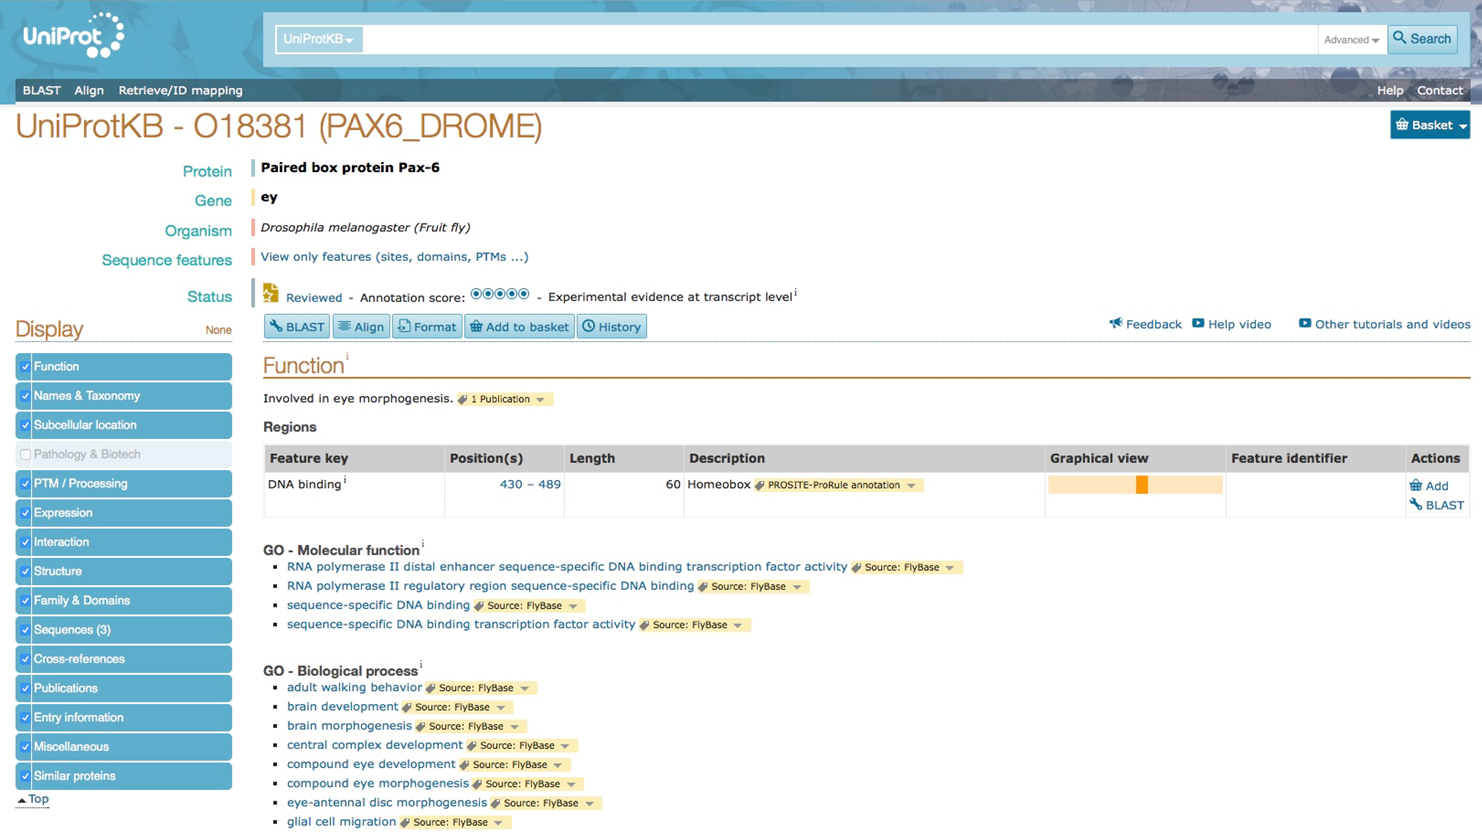
Drosophila ey protein in Uniprot database
Alignment of these two sequences can be performed directly in UniProt by selecting the 'Align' tab. One has to provide the two sequences or UniProt identifiers to perform the alignment.
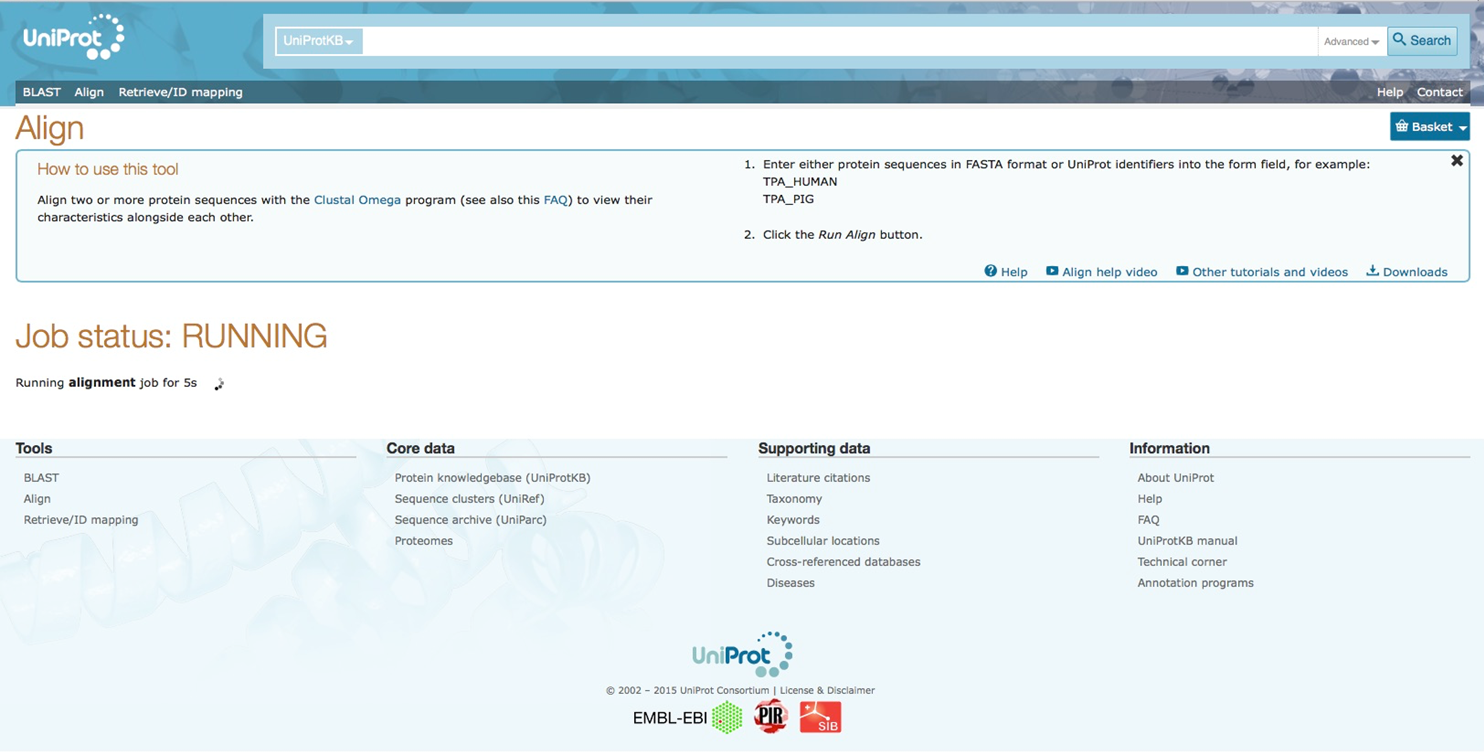
Align in Uniprot database
In the result one can see the alignment of the two protein sequences. Two blocks of similar sequence can be distinguished. Since the two genes, PAX6 and ey, are involved in the same biological process in human and drosophila, respectively, these blocks represent functionally conserved amino acids between two species.
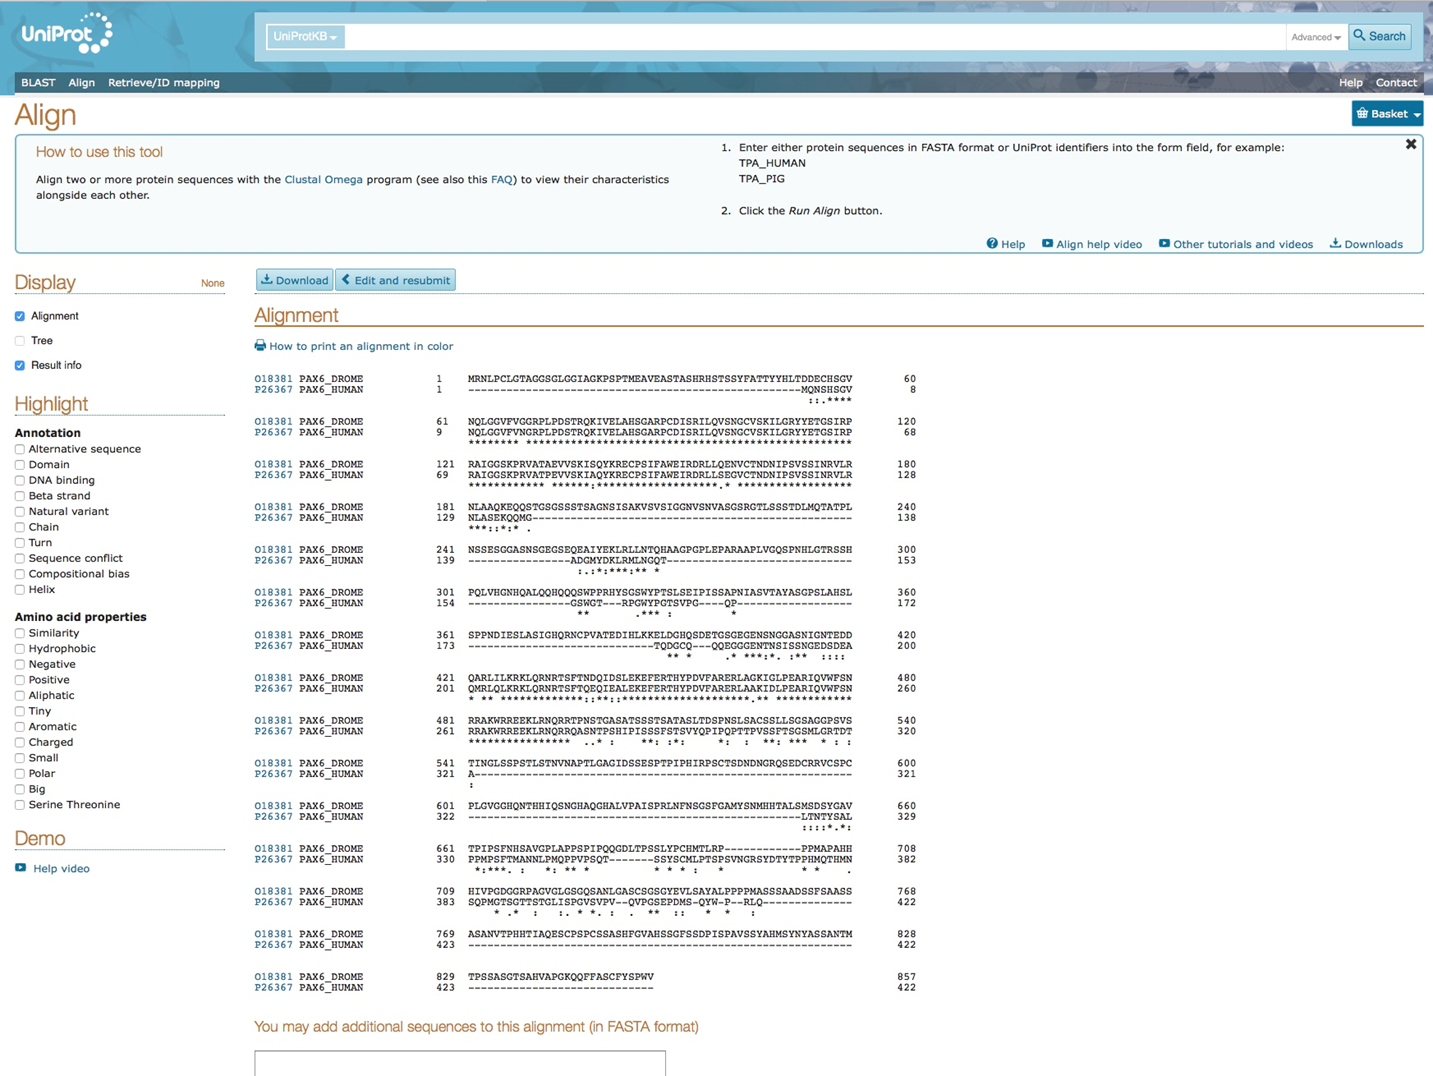
Alignment human PAX6 and drosophila ey in Uniprot database
By selecting certain annotation domains in the protein sequence, UniProt highlights the corresponding amino acids involved in these annotations. Highlighting the domains and DNA binding domains shows overlap between the two blocks of conserved amino acid sequences in human and drosophila.
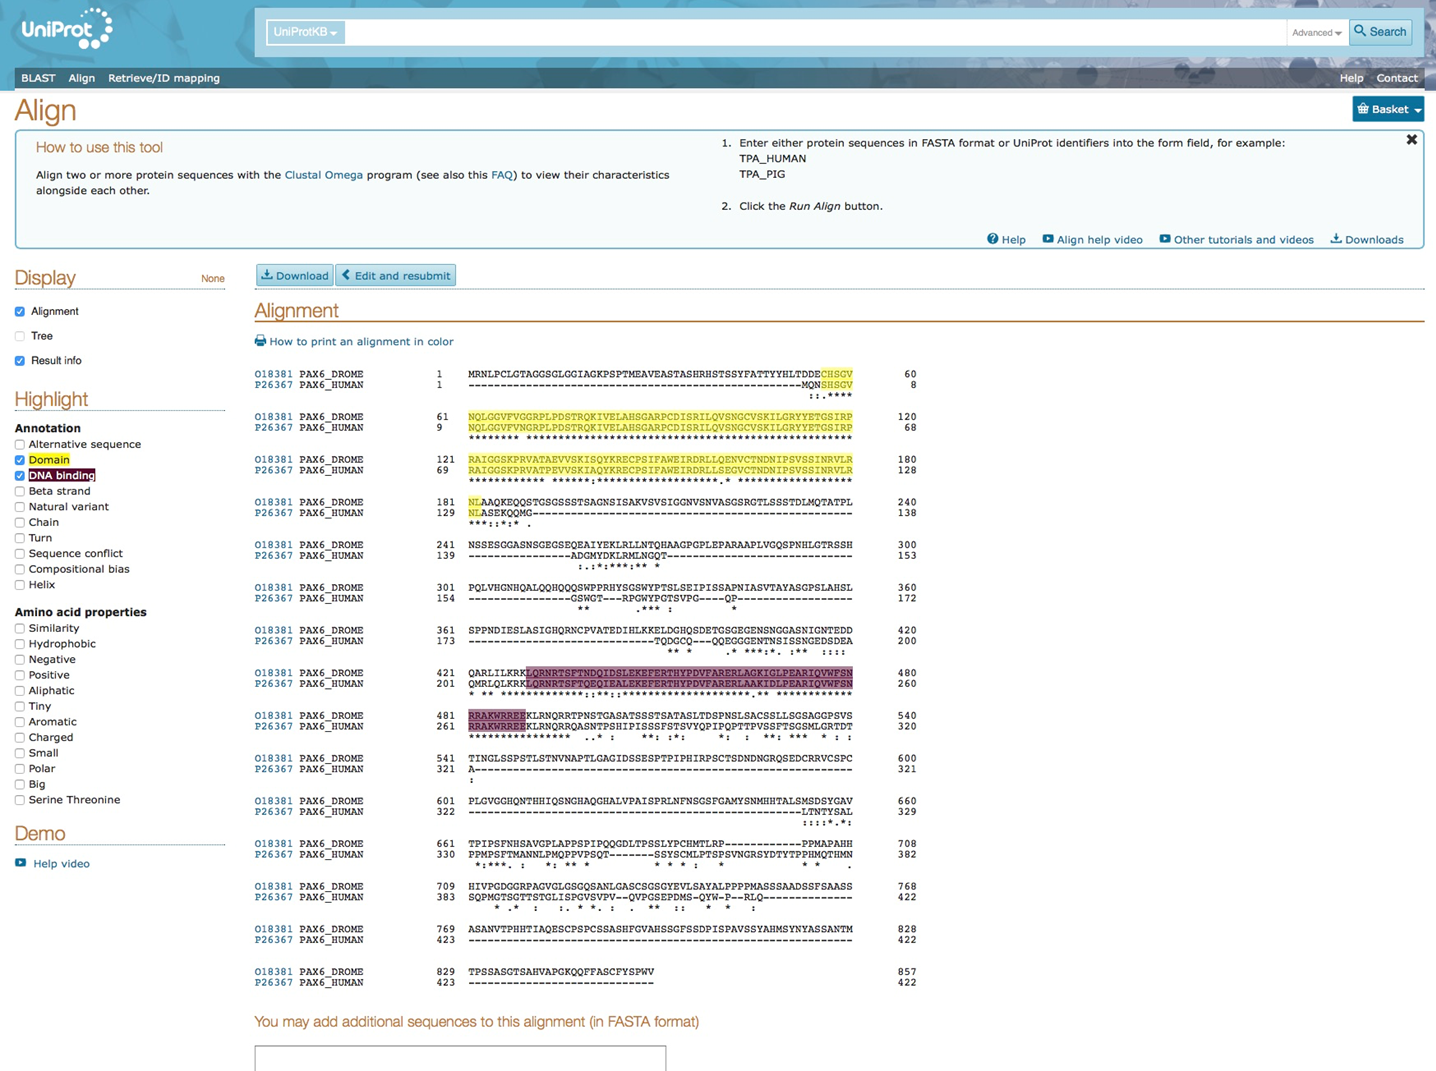
Alignment human PAX6 and drosophila ey in Uniprot database: annotation domains in protein sequence alignment
Alignments can also be performed through directly using the alignment algorithms: Needleman-Wunsch and Smith-Waterman. This can be done through the web-interface of EMBOSS or via the command-line:
needle -asequence ey.fa -bsequence PAX6.fa -gapopen 10 -gapextend 0.5 -outfile ey-PAX6-needle.txt


water -asequence ey.fa -bsequence PAX6.fa -gapopen 10 -gapextend 0.5 -outfile ey-PAX6-water.txt 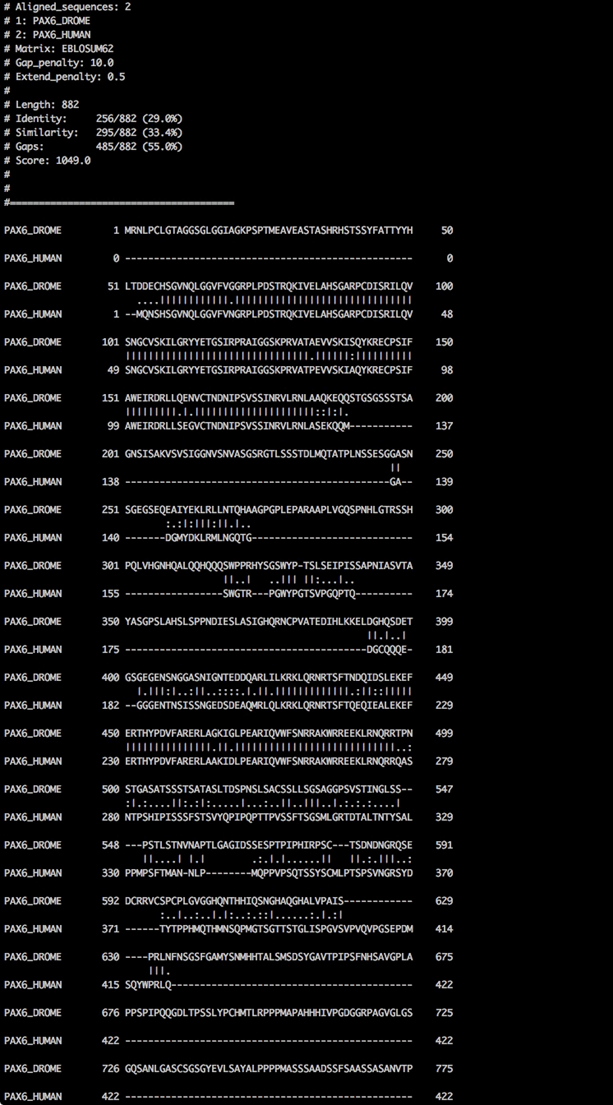
Needleman-Wunsch alignment
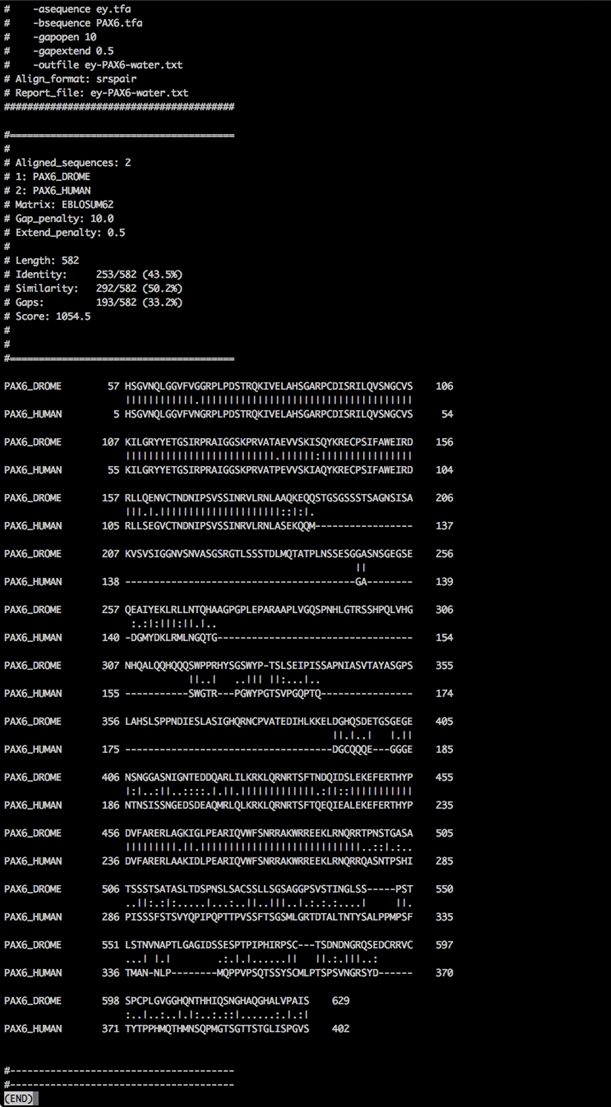
Smith-Waterman alignment
Comparing the output of the two alignment algorithms, shows us the global and local nature of the alignment algorithm of Needleman-Wunsch and Smith-Waterman, respectively.
To identify similar regions in both protein sequences, we can also use dotmatcher to perform a dotplot. Similar regions of sequence are characterized by diagonal lines. dotmatcher can be run through the EMBOSS web-interface or via the commandline:
dotmatcher -asequence ey.fa -bsequence PAX6.fa -graph png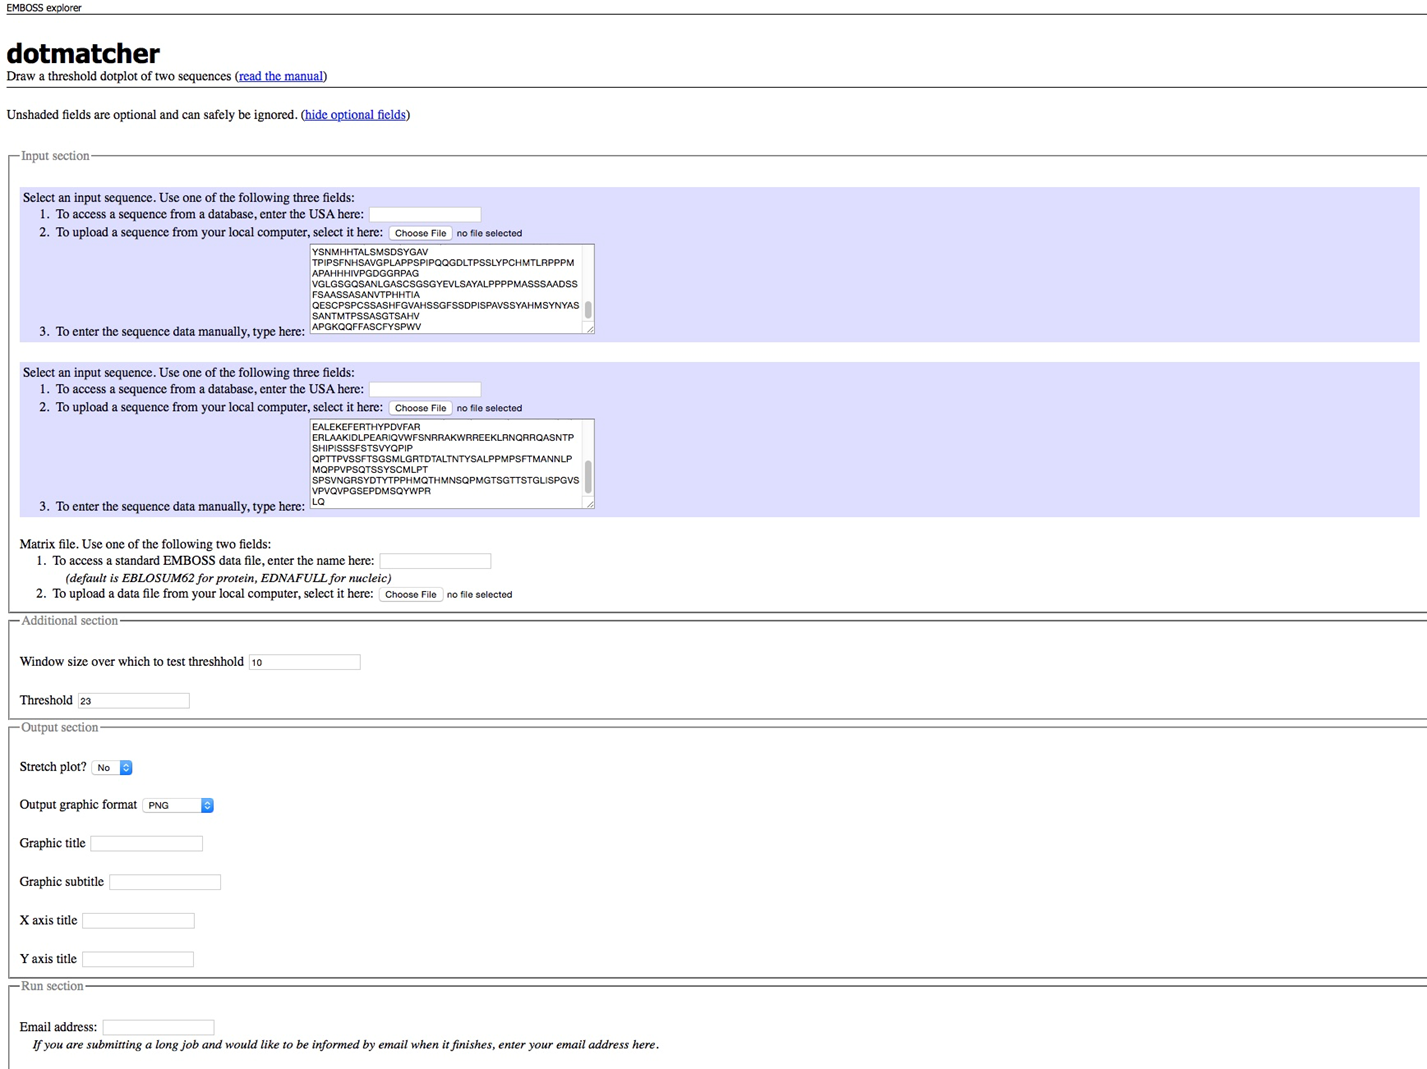
Dotmatcher via EMBOSS

Dotplot of human PAX6 and drosophila ey protein alignment via Dotmatcher (EMBOSS)